
Real-Time Analytics for Musicians: What to Track and Why
Musicians, stop guessing and start acting. Real-time analytics let you monitor your song's performance within minutes of release, helping you make smarter, faster decisions. Here's what to focus on:
- Save Rate: Tracks how many listeners save your song. A rate above 15% signals strong engagement.
- Stream Velocity: Measures how quickly streams grow. Steady declines over three weeks? Time to adjust.
- Playlist Sources: Know where your streams come from - algorithmic streams should make up at least 40%.
- Follower Growth: Converts casual listeners into loyal fans. A 20% listener-to-follower conversion rate is ideal.
- Traffic Insights: Tools like PromoLinks.me track pre-saves, clicks, and conversions for effective campaigns.
Why it matters: Real-time data shows what works and what doesn’t - while it still matters. Learn how to interpret these metrics and adjust your strategy for better results.
Explained: How to read Spotify analytics THE RIGHT WAY
sbb-itb-e819543
Key Metrics Musicians Should Track
To stay ahead in the music industry, it's crucial to monitor metrics that highlight current trends and offer insights into what lies ahead. Here's what you should focus on.
Streaming Performance Indicators
When it comes to streaming, two metrics stand out: save rate and stream velocity.
- Save rate is calculated by dividing the number of saves by the total streams. A save rate of 15% or higher is considered strong, while anything below 8% might indicate that the first 30 seconds of your track aren't engaging enough.
- Stream velocity measures how quickly streams are growing week over week. If your streams decline for three consecutive weeks, it’s a sign that the algorithm may be reducing your track's visibility.
"Stop tracking monthly listeners as your primary metric - it only tells you what already happened." - Chartlex
Monthly listener counts are lagging indicators, meaning they show past performance. On the other hand, save rate and stream velocity are leading indicators that can forecast your track's future trajectory.
Playlist and Algorithmic Metrics
Understanding where your streams originate is just as important as tracking the numbers. Spotify for Artists provides a source of streams breakdown, detailing whether your plays come from editorial playlists, algorithmic recommendations, your artist profile, or external links.
A heavy reliance on playlists - over 70% of your streams - is often referred to as "borrowed growth" and can be risky. For sustainable success, aim for at least 40% of streams from algorithmic sources like Discover Weekly, Radio, or Autoplay.
| Traffic Source | Healthy Target | Warning Sign |
|---|---|---|
| Algorithmic (Radio, Autoplay) | 40%+ of total streams | Flat or declining share |
| Playlist (Editorial/Curated) | Under 60% of total streams | Over 70% (fragile growth) |
Tracking these metrics can help you evaluate how well your streams are converting into lasting fan engagement.
Fan and Audience Growth Metrics
Follower growth is often overlooked but incredibly important. Followers are notified of your new releases through Spotify’s Release Radar and "What’s New" feed. On average, followers are 3 times more likely to stream your music within six months.
Pay attention to your listener-to-follower conversion rate, especially around new releases. A conversion rate of 20% or more indicates that your music is effectively turning casual listeners into dedicated fans. If this rate is under 10%, it might be worth revisiting your profile or branding.
Traffic and Conversion Data
Streaming platforms only show part of the picture. To understand how fans move from discovery to action - whether it’s pre-saving a track, signing up for your email list, or purchasing merchandise - you need detailed data on link performance.
Tools like PromoLinks.me provide real-time insights into click-through rates, pre-save conversions, and email sign-ups. For instance, if an Instagram ad drives clicks but doesn’t lead to pre-saves, it might indicate that your landing page needs improvement.
Revenue and Monetization Metrics
Revenue tracking often lags due to delays in royalty payments from streaming platforms. Instead of focusing solely on streaming income, monitor direct download sales and revenue generated through campaigns.
Use these revenue metrics to compare performance across different releases or to determine whether a specific campaign delivered a worthwhile return on investment.
How to Read Real-Time Data and Make Better Decisions
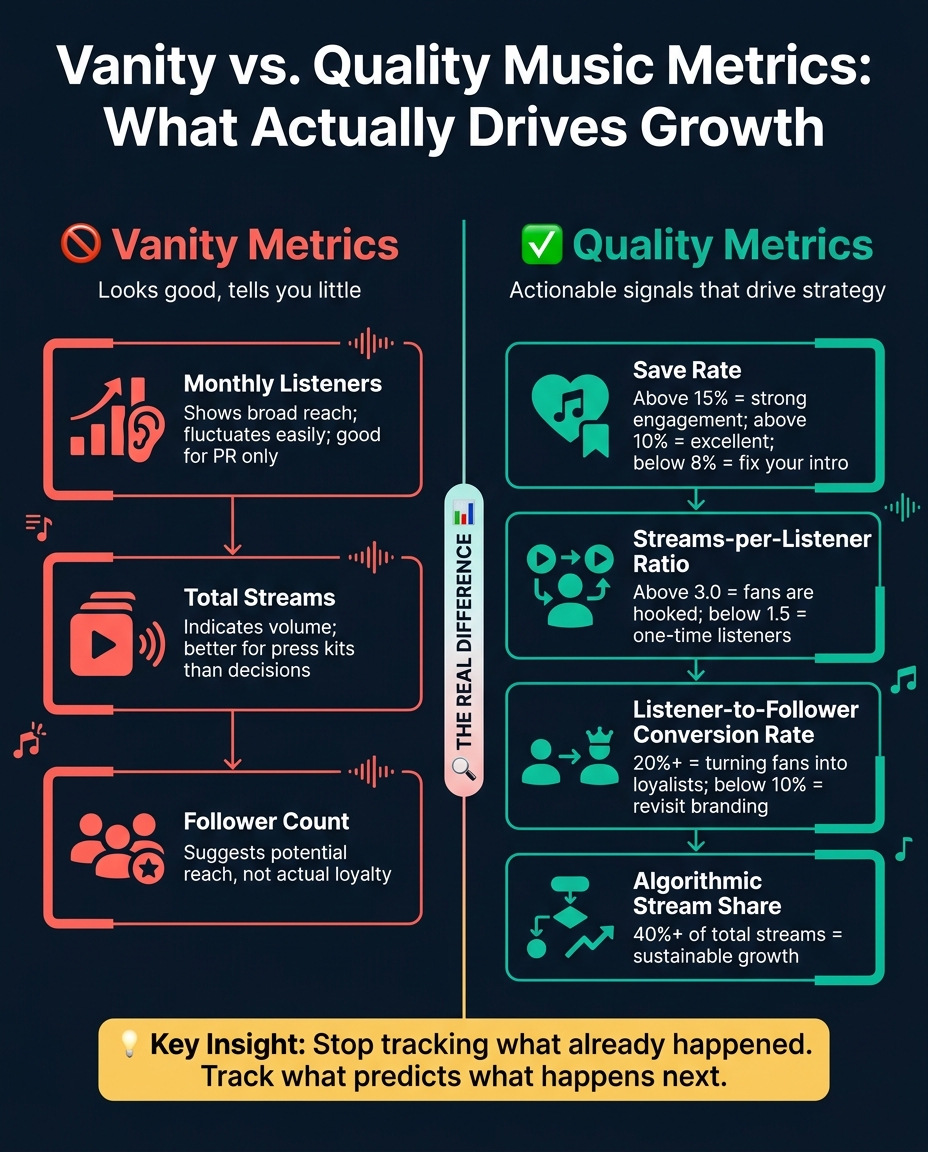
Vanity vs. Quality Music Metrics: What Actually Drives Growth
Collecting data is just the beginning. The real challenge is interpreting it effectively - and knowing when to act on it.
Reading Early Release Data Without Overreacting
The first day after a release is all about making sure the basics are in place. Is your song live? Is the metadata correct? Are the links working? That’s it. Don’t jump to conclusions based on Day 1 numbers. Early stream counts only start to matter around Days 2 and 3. For instance, if your streams jump from 500 on Day 1 to 700 on Day 2, it’s a good sign that your marketing efforts are gaining traction or the algorithm is starting to take notice. On the other hand, a steady drop in streams could indicate low engagement, which might need attention.
To stay on track, focus on four key checkpoints: Day 1 (technical check), Day 3 (early trends), Day 7 (a clearer picture), and Day 30 (a full campaign review). These milestones help you move from surface-level observations to meaningful audience insights.
Quality Metrics vs. Vanity Metrics
Once you’ve reviewed the initial trends, it’s time to dig into metrics that actually matter. While total streams and monthly listener counts might look impressive, they don’t necessarily reflect real fan engagement. These are vanity metrics - great for bragging rights but not much else.
Instead, prioritize quality metrics like your save rate. A save rate of 4–6% is a strong indicator of listener engagement and can trigger algorithmic support. If it’s over 10%, you’re in an excellent position. Push.fm even calls this a strong signal to Spotify that your song has long-term potential. Similarly, the streams-per-listener ratio can reveal how often fans are coming back to your music. A ratio above 3.0 means listeners are hooked, while anything below 1.5 suggests they’re listening once and moving on.
If your save rate is high but your skip rate is also climbing, it might mean the intro of your track isn’t grabbing attention. Consider tweaking the opening to keep listeners engaged.
| Metric | Vanity or Quality | What It Actually Tells You |
|---|---|---|
| Monthly Listeners | Vanity | Shows broad reach; good for PR but fluctuates |
| Save Rate | Quality | Reflects listener intent and algorithm support |
| Total Streams | Vanity | Indicates volume; better for press kits |
| Streams-per-Listener | Quality | Measures replay behavior and fan connection |
| Follower Count | Vanity | Suggests potential reach, not actual loyalty |
Focusing on quality metrics helps you understand genuine engagement and paves the way for identifying where your fan base is most active.
Finding Patterns in Traffic and Audience Data
Once you’ve analyzed your streaming and fan growth data, geographic insights can guide your next steps. For example, having 2,500 listeners concentrated in one city is far more actionable than 10,000 listeners scattered across hundreds of locations. A concentrated fan base opens doors for targeted ads, small venue performances, or location-specific social campaigns.
If you notice a sudden spike in streams from a new city, act quickly. Post something localized on Instagram or TikTok, or reach out to influencers in that area. Also, keep an eye on your source of streams data. A strong release often starts with heavy external and direct-fan traffic, then shifts toward algorithmic sources as Spotify picks up on the engagement signals. If algorithmic traffic doesn’t grow, it might mean your early engagement wasn’t enough to trigger features like Discover Weekly or Autoplay.
Finally, make it a habit to spend 20 minutes each month comparing your stream spikes to your social media activity. This quick “social correlation” check can reveal which types of posts are driving listeners to your music - and which ones might not be worth repeating.
Building a Real-Time Analytics Workflow
Using Analytics in Pre-Release Planning
When preparing for a release, focus on the past 7-day stream counts instead of total all-time streams. Why? Because the former serves as a decision metric, while the latter is more of a vanity metric.
Make sure to submit your editorial pitch on Spotify for Artists at least 7 days before your release. Keep a tracking sheet that includes pre-save counts, pitch submission dates, and promotion details. This baseline will help you interpret real-time data effectively once your release goes live.
If you've been testing snippets on TikTok or Reels, pay attention to which hooks creators are repeating. These trends can guide your pre-release campaign strategy by highlighting which creative angles resonate most.
With this groundwork in place, you can shift your attention to structured monitoring during release week.
Daily Monitoring During Release Week
Avoid the temptation to check your stats every hour during release week - it can lead to analysis paralysis. JC Sanchez, Founder & CEO of Orphiq, puts it best:
"Real-time data is noisy. The first 24 hours tell you almost nothing about long-term performance. Week one gives you early signals. Week four gives you trends."
Stick to specific checkpoints to stay aligned with your data strategy:
| Timeframe | Check Frequency | What to Look For |
|---|---|---|
| Day 1 | Once (evening) | Is the song live? Is the artwork correct? |
| Days 2–3 | Once | Is stream velocity accelerating or declining? |
| Day 7 | Thorough review | Is the algorithm or your marketing driving plays? |
| Day 14 | Check-in | Is week 2 at least 50–80% of week 1 totals? |
| Day 30 | Full analysis | What adjustments should be made for the next release? |
Once you've gathered these early insights, use them to refine your campaign.
Adjusting Campaigns After Release
Start by analyzing where your streams are coming from - algorithmic playlists, editorial features, listener libraries, or external promotions. If most streams are driven by your marketing efforts but algorithmic streams remain flat, it might be time to focus on boosting engagement signals like shares, saves, and playlist adds.
If you notice unexpected geographic clusters performing well, act quickly. Shift your ad spend to these regions and create localized social content to capitalize on the momentum.
For your ad creatives, rely on real-time click-through rate (CTR) data to run A/B tests. If one version of your ad consistently outperforms another, prioritize the successful creative and phase out the weaker one. By continuously tweaking your campaign based on real-time metrics, your release strategy can adapt to listener behavior as it unfolds.
Tools for Real-Time Music Analytics
Once you’ve got a handle on real-time insights, the next step is finding the right tools to track and act on them effectively. No single tool will check every box, so the best strategy is to combine native platform analytics with a cross-platform tracking tool. Each serves a distinct role in building a complete picture of your audience and performance.
Native Analytics on Streaming and Social Platforms
Spotify for Artists is an essential starting point for any independent musician. It breaks down streams by source - whether they’re coming from algorithmic playlists, editorial placements, listener libraries, or external links. This makes it easier to see if your marketing efforts are making a difference. You can also use the save rate benchmarks mentioned earlier to measure your progress. The platform segments listeners into categories like Super Listeners, active listeners, and programmed listeners, helping you make quick, informed decisions to propel your career forward.
Apple Music for Artists offers something Spotify doesn’t: real-time "Listening Now" data. This lets you watch your listener count update in real time - perfect for gauging the immediate impact of a social media post or press coverage. It also tracks radio spins across more than 40,000 terrestrial and digital stations worldwide, giving you a clearer picture of your airplay performance.
YouTube Studio adds another layer of insight, offering metrics like watch time and audience demographics. This is especially useful if your release strategy includes video content.
PromoLinks.me's Real-Time Analytics Features
While native tools focus on what happens after engagement, PromoLinks.me tracks activity before fans even land on your streaming page. Its real-time analytics monitor clicks, conversions, and traffic sources, giving you instant feedback on how your campaigns are performing.
The platform’s smart links update in real time, so you can pinpoint which social channel is driving traffic the moment your post goes live. With UTM tracking, you can generate source-specific URLs for platforms like Instagram, TikTok, or email, eliminating guesswork about where your clicks are coming from. The geographic data drills down to the city level, which ties in nicely with the touring strategies discussed earlier.
For music releases, the Pre-Save Analytics module is a standout feature. It tracks total pledges, successful saves, and conversion rates. On average, pre-save campaigns through PromoLinks.me result in 3.2x more day-one saves compared to manual sharing. Plus, about 68% of fans who pre-save a track will stream it within the first 48 hours of release. The platform automates this process, converting pre-saves into actual library saves at 6:00 AM UTC on release day - no manual work required.
Another handy feature is Playlist Spotlight, which creates deep links that open your track directly within a playlist rather than on a standalone page. This boosts engagement signals to Spotify’s algorithm more effectively than a generic link. PromoLinks.me also allows you to export analytics as PDF or CSV files, making it easy to share data with your team or collaborators.
"The data itself is not the value. The value is what the data tells you to do next." - JC Sanchez, Founder & CEO, Orphiq
Analytics Tools Side-by-Side Comparison
Here’s a quick breakdown of how these tools stack up:
| Feature | Spotify for Artists | Apple Music for Artists | PromoLinks.me |
|---|---|---|---|
| Primary Data Source | Internal Spotify streams & saves | Internal Apple Music & Shazam | Cross-platform clicks & conversions |
| Real-Time Metrics | Streams, saves, active listeners | "Listening Now", same-day plays | Clicks, CTR, geo-data, referrers |
| Update Frequency | Daily (some real-time) | Same-day / real-time | Instant (real-time) |
| Geographic Data | Country & city level | Country & city level | Country & city level |
| Referral Tracking | Limited to Spotify sources | Limited | UTM source & referrer site |
| Conversion Tools | N/A | N/A | Pre-saves, RSVPs, email capture |
| Cost | Free | Free | From $7/month |
Looking ahead, PromoLinks.me plans to integrate direct DSP analytics by May 2026, including Spotify stream counts and YouTube view data. This would provide a unified dashboard for true cross-platform comparisons.
Conclusion: Putting Real-Time Analytics to Work for Your Music Career
Real-time analytics aren't just about tracking numbers - they're about turning metrics like save rate and stream velocity into meaningful actions. As De Novo Agency aptly puts it, "The real value of a dashboard is what it helps you do next week."
The key is to shift focus from vanity metrics, such as total streams or follower counts, to actionable data that shapes strategy. For instance, a Spotify save rate above 5% suggests strong potential for algorithmic growth, while an email open rate over 30% points to real fan engagement. These are the figures that can guide your next steps.
You don’t need to obsess over analytics daily. Instead, aim for consistent, structured check-ins. Set aside time to track key metrics, review monthly trends, and evaluate releases every 2–4 weeks. This approach helps you see the bigger picture of your career, not just the performance of one release.
Platforms like Spotify for Artists and Apple Music for Artists provide valuable insights into post-engagement activity. Meanwhile, tools like PromoLinks.me help you connect the dots by identifying which social channels, cities, or campaigns are driving those interactions - bridging your marketing efforts with streaming results.
FAQs
What’s the best real-time metric to watch right after release?
The save rate is the most important real-time metric to track after releasing a track. This metric gives you a quick sense of how well listeners are engaging with your music. Plus, it plays a key role in signaling streaming platforms, like Spotify, to push your track to more listeners. While many focus on total streams, the save rate provides more actionable feedback. For the best results, aim for a save rate of at least 5% within the first 48 hours - this can increase your chances of landing on algorithmic playlists.
How do I know if Spotify’s algorithm is picking up my track?
To see if Spotify’s algorithm is noticing your track, head over to the Source of Streams section in your Spotify for Artists dashboard. Pay attention to streams coming from algorithmic sources like Radio, Release Radar, Discover Weekly, and Autoplay.
If you notice steady growth in these areas, paired with a high save rate and a low skip rate, it’s a good sign that your track is connecting with listeners and getting more support from Spotify’s algorithms.
What should I change if my save rate is low but my clicks are high?
If you're seeing plenty of clicks but not many saves, it likely means your music isn't resonating with the audience you're attracting. First, take a closer look at your audience targeting. Are you reaching listeners who genuinely match your genre and style? If your targeting seems on point, the problem might be with the track itself - especially the first 30 seconds. Focus on refining your hook to grab attention right away before you invest more in promoting the track.
Related Blog Posts
Ready to create your smart links?
Join thousands of artists using PromoLinks to promote their music smarter.
Get Started Free