Top 7 Analytics Tools for Independent Artists
Top 7 Analytics Tools for Independent Artists
If I had to cut this whole article down to one point, it would be this: streams alone won’t tell me where my next dollar should go. What helps more is a small set of numbers - save rate, monthly listeners, top cities, watch time, playlist adds, estimated earnings, and link clicks.
Here’s the short version:
- Spotify for Artists helps me track saves, playlists, and top cities
- Apple Music for Artists helps me spot demand through Shazam and city data
- YouTube Analytics for Artists shows me CTR, watch time, and repeat viewers
- Songstats helps me track playlist adds and chart movement across platforms
- Viberate helps me compare my growth against similar artists
- Soundcharts helps me watch radio, playlists, and market movement
- PromoLinks.me helps me track clicks, pre-saves, QR scans, and email signups
A few numbers from the article stand out:
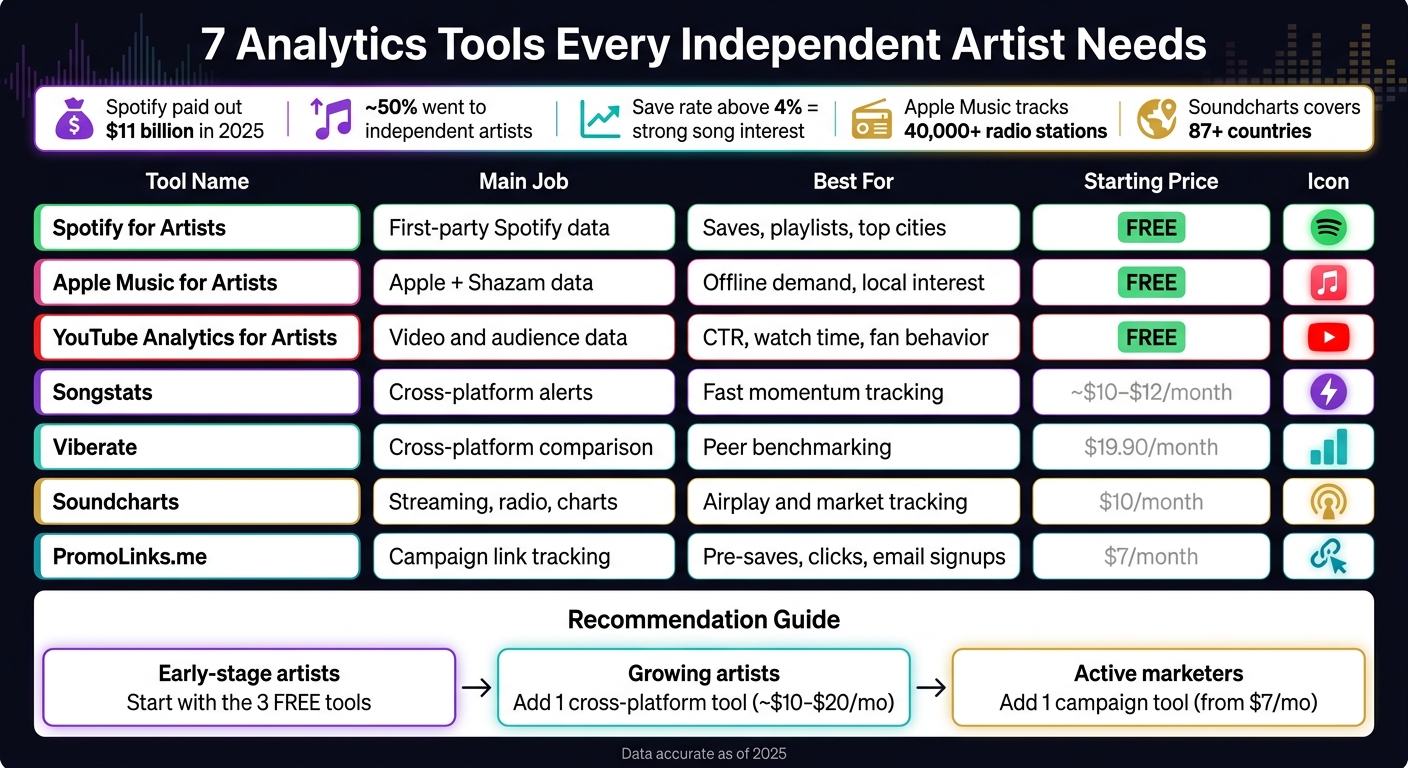
- Spotify paid out $11 billion in 2025
- About 50% of that went to independent artists
- A Spotify save rate above 4% can point to strong song interest
- Apple Music tracks airplay across 40,000+ stations
- Soundcharts tracks radio across 87+ countries
- PromoLinks.me starts at $7/month as part of a complete music marketing checklist for new releases.
7 Best Analytics Tools for Independent Artists: Features & Pricing
EMERGE Music Data Analytics for Artists
sbb-itb-e819543
Quick Comparison
| Tool | Main job | Best for | Starting price |
|---|---|---|---|
| Spotify for Artists | First-party Spotify data | Saves, playlists, top cities | Free |
| Apple Music for Artists | Apple + Shazam data | Offline demand, local interest | Free |
| YouTube Analytics for Artists | Video and audience data | CTR, watch time, fan behavior | Free |
| Songstats | Cross-platform alerts | Fast momentum tracking | ~$10–$12/month |
| Viberate | Cross-platform comparison | Peer benchmarking | $19.90/month |
| Soundcharts | Streaming, radio, charts | Airplay and market tracking | $10/month |
| PromoLinks.me | Campaign link tracking | Pre-saves, clicks, email signups (see our pre-save campaign guide) | $7/month |
My takeaway: I’d start with the free dashboards first. Then I’d add one cross-platform tool if I needed a better read across services, and one campaign tool if I was spending money on promo. That’s the simple way to turn music analytics that matter into release, ad, and tour decisions.
1. Spotify for Artists
Cost: Free
Spotify for Artists is the best place to start if you’re an independent artist trying to figure out what’s working on Spotify. It gives you track-level performance, saves, playlist placements, and audience geography straight from Spotify’s own data. That means you’re looking at the closest thing to a direct read on your Spotify performance. Use it first to find the listeners most likely to become buyers.
The Source of Streams breakdown separates active streams from programmed streams. That split matters. It helps you find the listeners who are more likely to convert, then use that info to shape your marketing, collabs, and tour routing.
If you want to spot a song with breakout potential, watch save rate. A healthy save rate is above 4%. Below 2% usually means the song isn’t connecting with the audience. If a track has a high save rate but limited reach, that’s a strong sign it deserves more promotion.
Top Cities shows where your listeners are clustered. Start spending in those cities, and book shows there before branching out.
Super Listeners are Spotify’s clearest revenue signal. A small group of fans can drive a large share of streams, merch sales, and ticket sales. In plain English: Super Listener growth tells you far more about whether your career is moving toward steady revenue than listener volume alone.
Once you know your Spotify baseline, compare those same signals on the next platform dashboards.
2. Apple Music for Artists
Cost: Free
Apple Music for Artists gives you a first-party look at how your music is doing across Apple Music, the iTunes Store, Shazam, and radio. That matters because it helps you check demand beyond Spotify.
One of the most useful parts is the mix of Shazam activity and location data. If people in a certain city keep Shazaming your song, that’s a strong signal. It can point you toward places that may support ads, shows, and music promotion across platforms.
The dashboard also tracks airplay across more than 40,000 terrestrial and digital radio stations in over 200 countries and regions.
Its standout metric is Shazam Count. When someone Shazams your song, it usually means they heard it somewhere out in the world and wanted to know what it was. That’s why Shazam spikes can be a good sign of offline demand.
The Places tab breaks your audience down by city, state, country, or region. This is where things get practical. Check Places against Shazam activity and radio reach. If the same cities show up near the top across all three, those are strong candidates for tour stops.
That overlap can also help you decide where to put local ad spend, pitch press, and plan promo using shareable music links. In plain English: if a city keeps showing up from different angles, pay attention.
Data refreshes daily, but it can lag by up to 48 hours. So if you just dropped a release this morning, don’t rush into same-day calls. Use this dashboard to confirm where listeners are already responding before you move to the next tool.
3. YouTube Analytics for Artists
Cost: Free (requires a verified Official Artist Channel)
YouTube Analytics for Artists shows how your videos, titles, and thumbnails pull in attention and discovery. Spotify and Apple Music tell you about listening demand. YouTube shows whether your visuals and titles can turn that demand into watch time. That makes it a strong place to judge which videos are worth paid spend, pre-save and release-day promo, or a merch and tour push.
The main metrics to watch are Click-Through Rate (CTR), Average Percentage Viewed (APV), and watch time. CTR tells you whether your title and thumbnail get the click. APV tells you whether the video keeps people watching. If retention drops early, the opening usually needs work.
The Traffic Sources tab gives you a clean read on where views come from. If most views come from external links, you're still leaning on outside promo. If Suggested Videos and Browse Features bring in strong traffic, YouTube is starting to recommend your content on its own.
The Audience tab helps you spot which viewers come back most often and which cities show the strongest response. It groups viewers into Fans and Superfans based on engagement frequency. Those are usually the people most likely to act when you drop merch, announce shows, or put out new music.
Song Rollup is also worth checking. It pulls together performance across your official uploads, Art Tracks, lyric videos, live videos, and fan-made content. If a fan edit beats your official video, that isn't just a fun surprise. It's a clue. Maybe the pacing works better, maybe the hook lands faster, or maybe the visual style connects more. Use those signals as your baseline before you compare cross-platform tracking.
4. Songstats
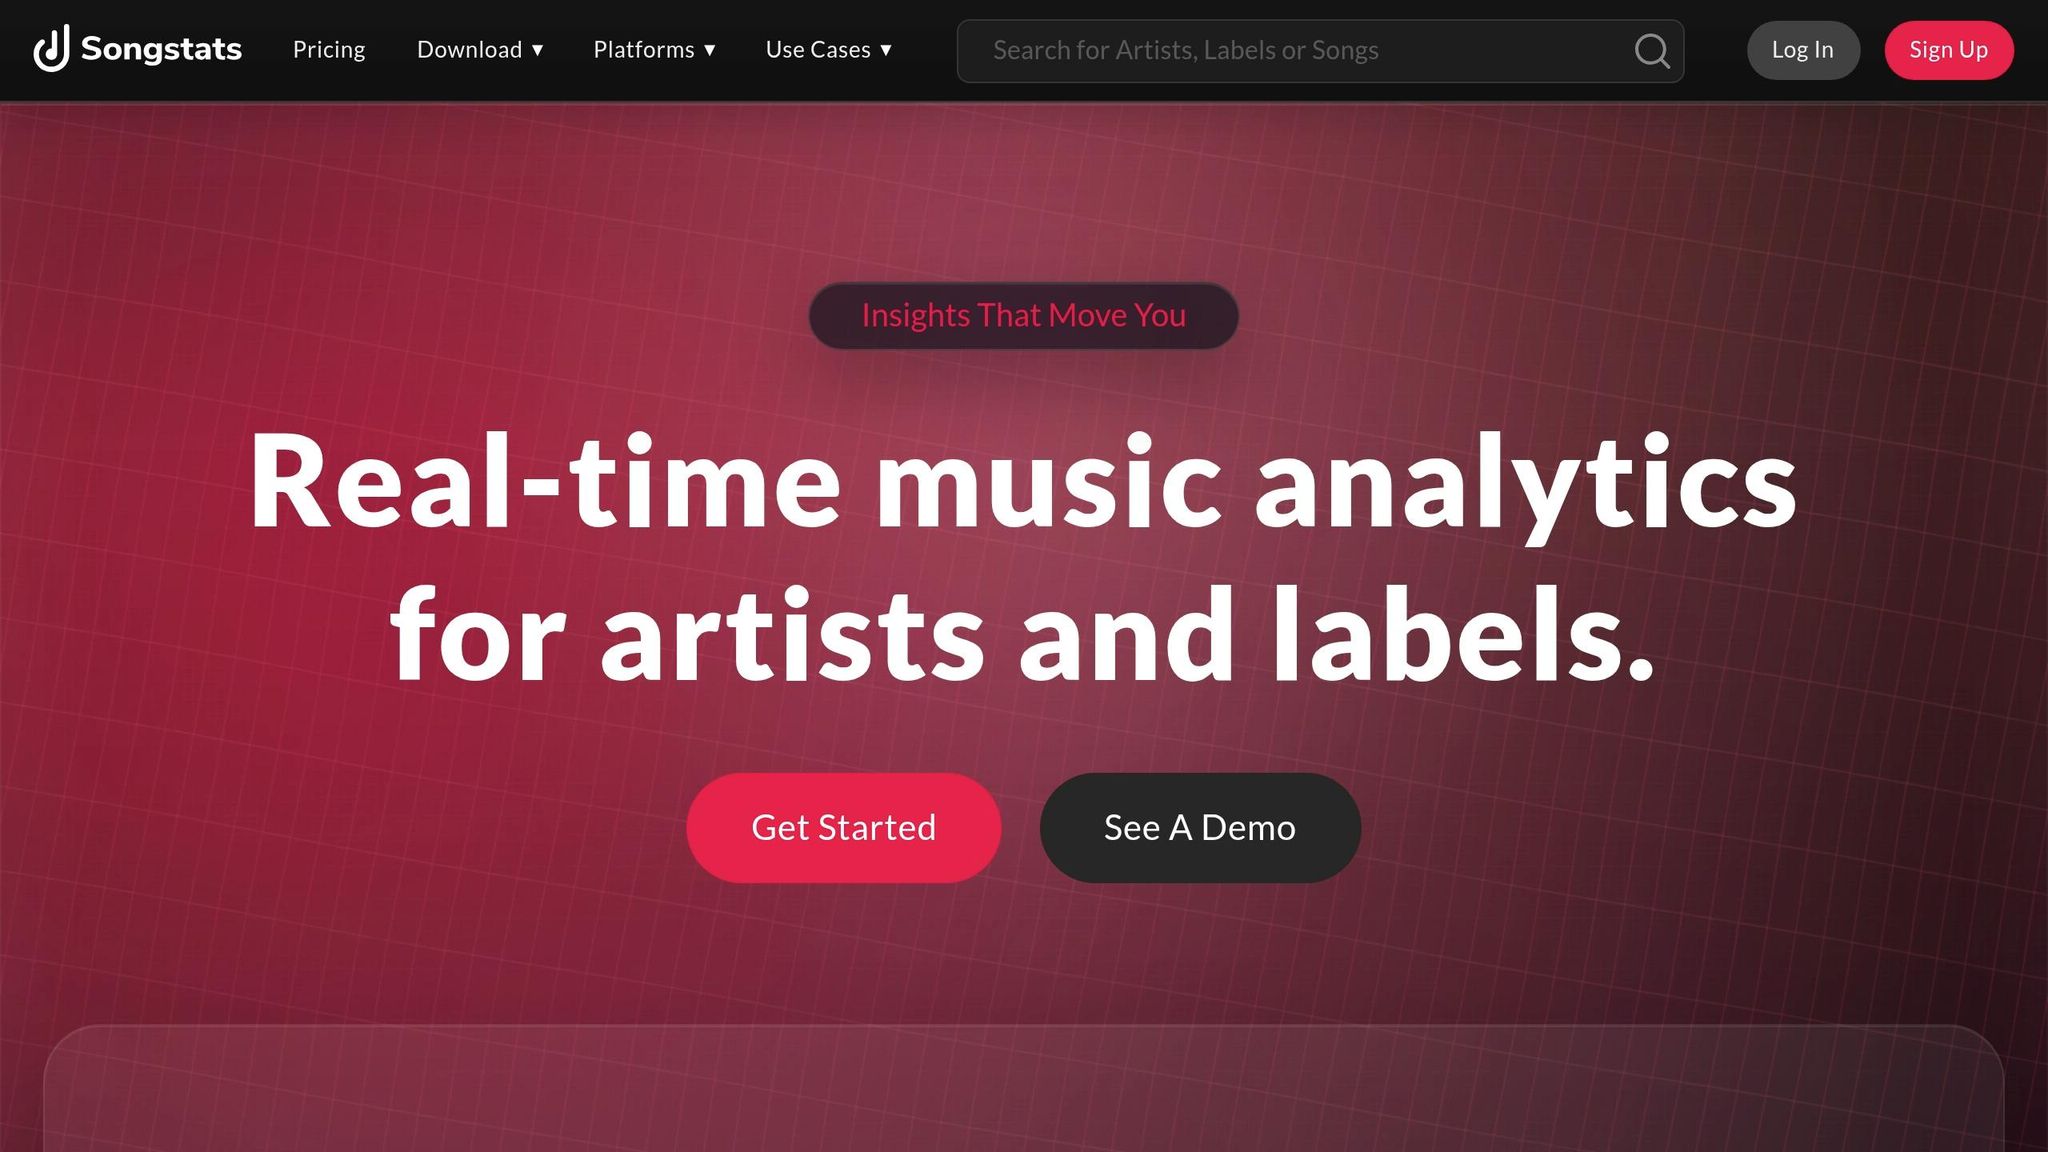
Cost: About $10–$12/month for the Artist Plan; about $20/month with Radiostats; about $100/month for the Professional tier
Songstats tracks cross-platform momentum in real time, which gives you a chance to move while a track is still on the way up. YouTube often tells you what already happened. Songstats is more about spotting the climb as it begins.
It sends push notifications for playlist adds, chart entries, and editorial placements. It also pulls streaming, radio, and social data into one dashboard, so you’re not bouncing between a music promotion tools.
That matters because alerts are only part of the story. When a track starts moving fast enough to hint at momentum, Songstats sends a push alert. Those early signals give you a window to do something with it, like:
- increase ad spend
- keep pitching
- post while attention is still building
Songstats also covers radio through Radiostats, which monitors airplay across more than 50,000 stations worldwide. That can help you catch movement before it fades.
For electronic artists, this tool stands out because it tracks Beatport, Traxsource, and 1001Tracklists natively.
When Songstats flags a playlist add or chart entry, post the shareable milestone artwork to Instagram or TikTok right away.
The mobile app is best for quick checks and fast action.
5. Viberate
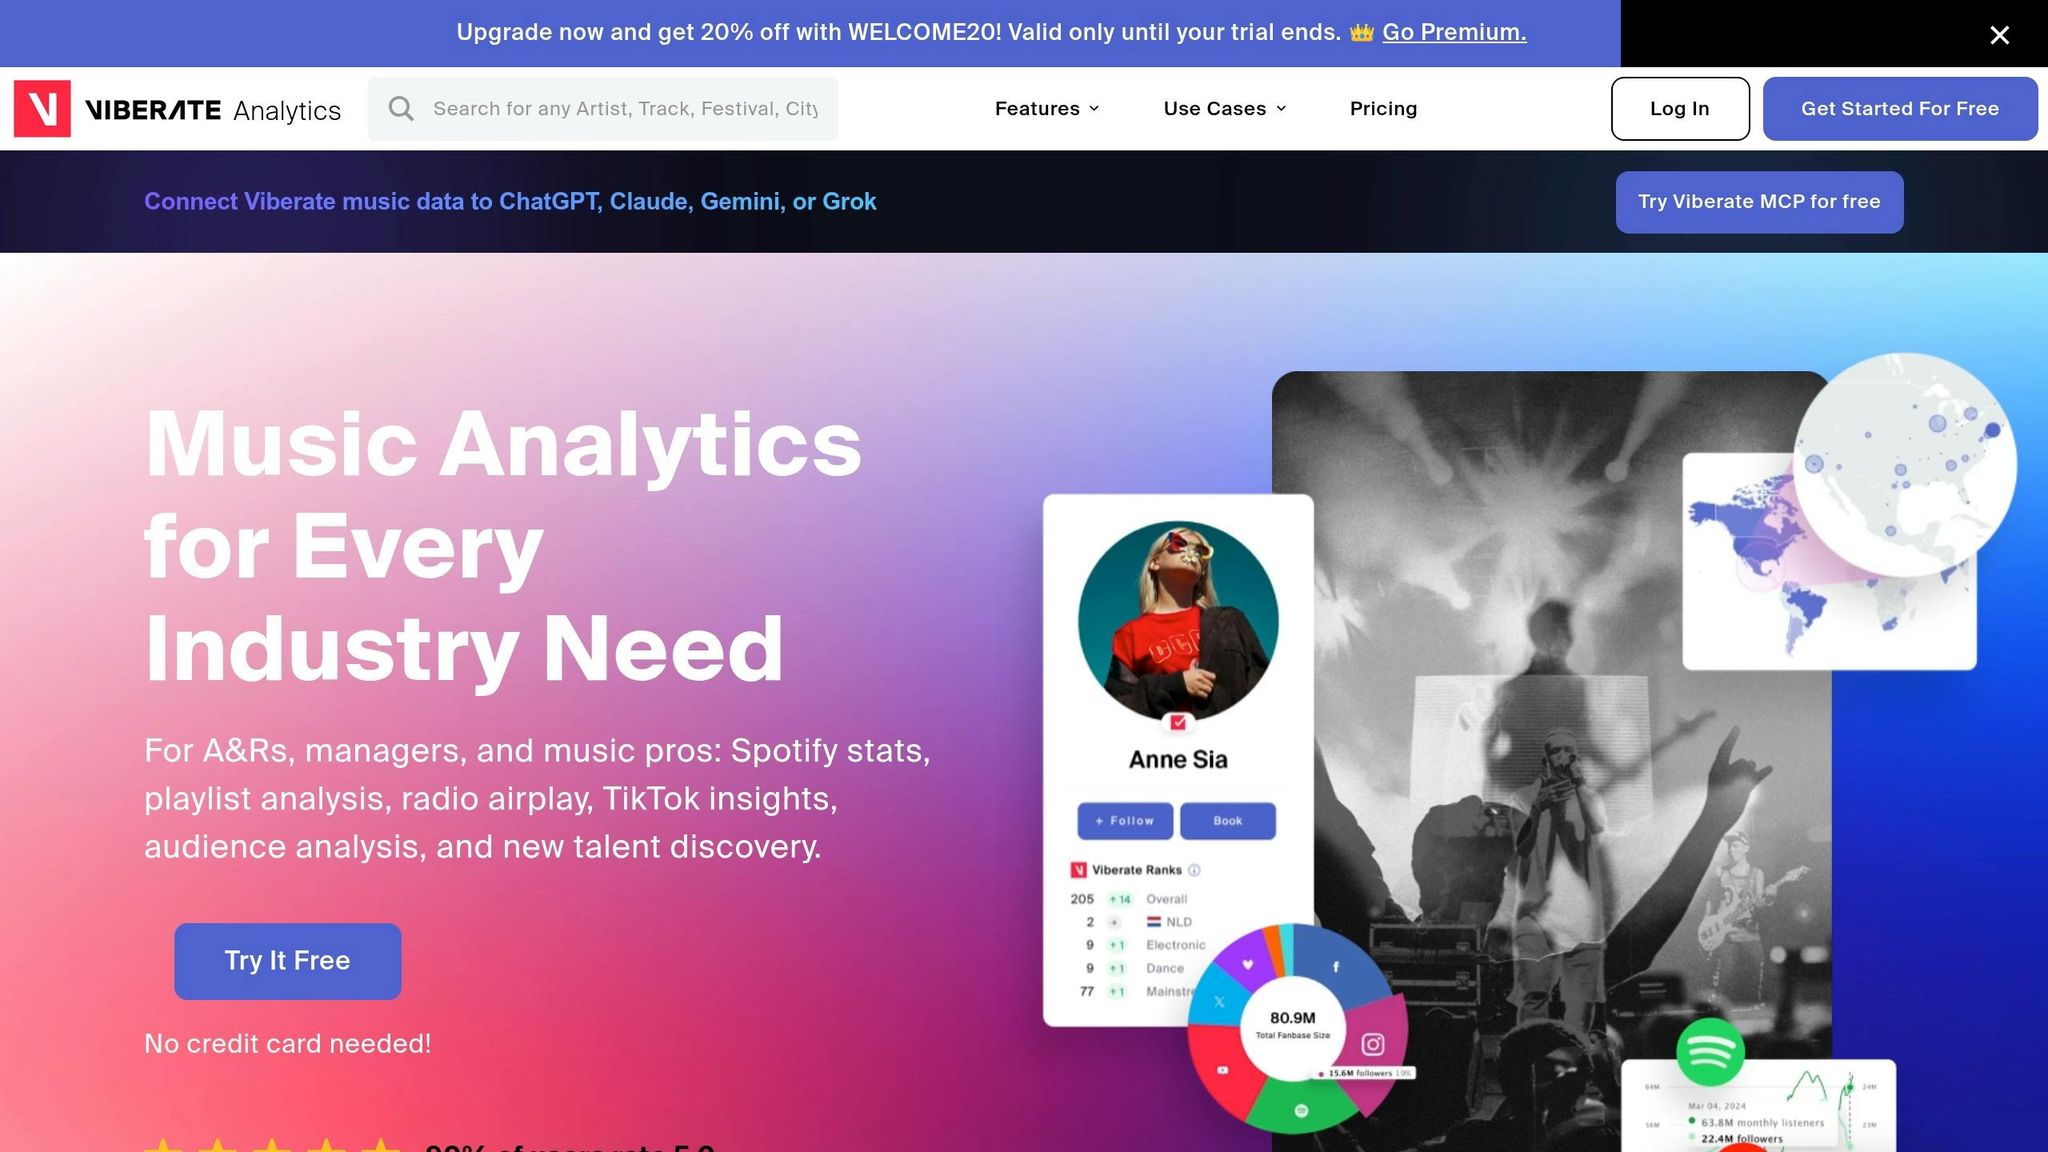
Cost: $19.90/month (billed annually at $239); Professional Plan: about €958/year; 2-day full-access trial available without a credit card
Songstats is great for tracking momentum. Viberate is more about context: how you stack up against other artists, and where your next dollar should go.
It pulls in data from Spotify, Apple Music, YouTube, TikTok, Instagram, SoundCloud, Deezer, Shazam, and 64,000+ radio stations, then puts benchmarking right at the center.
The Career Health benchmark scores your performance against artists in the same subgenre. If you want a clearer read on your position, the Compare Artists tool lets you line up as many as three artists across all tracked channels. That side-by-side view makes it easier to spot which peers have more reach, then tweak your campaign or release plan.
Audience Map breaks down listeners and followers by city, country, age, and gender for ad spend, show routing, and market-specific promo. You can find more music promotion guides to help turn these insights into action. So if you're trying to turn audience data into actual decisions, not just stare at charts, this is where Viberate starts to earn its keep.
6. Soundcharts
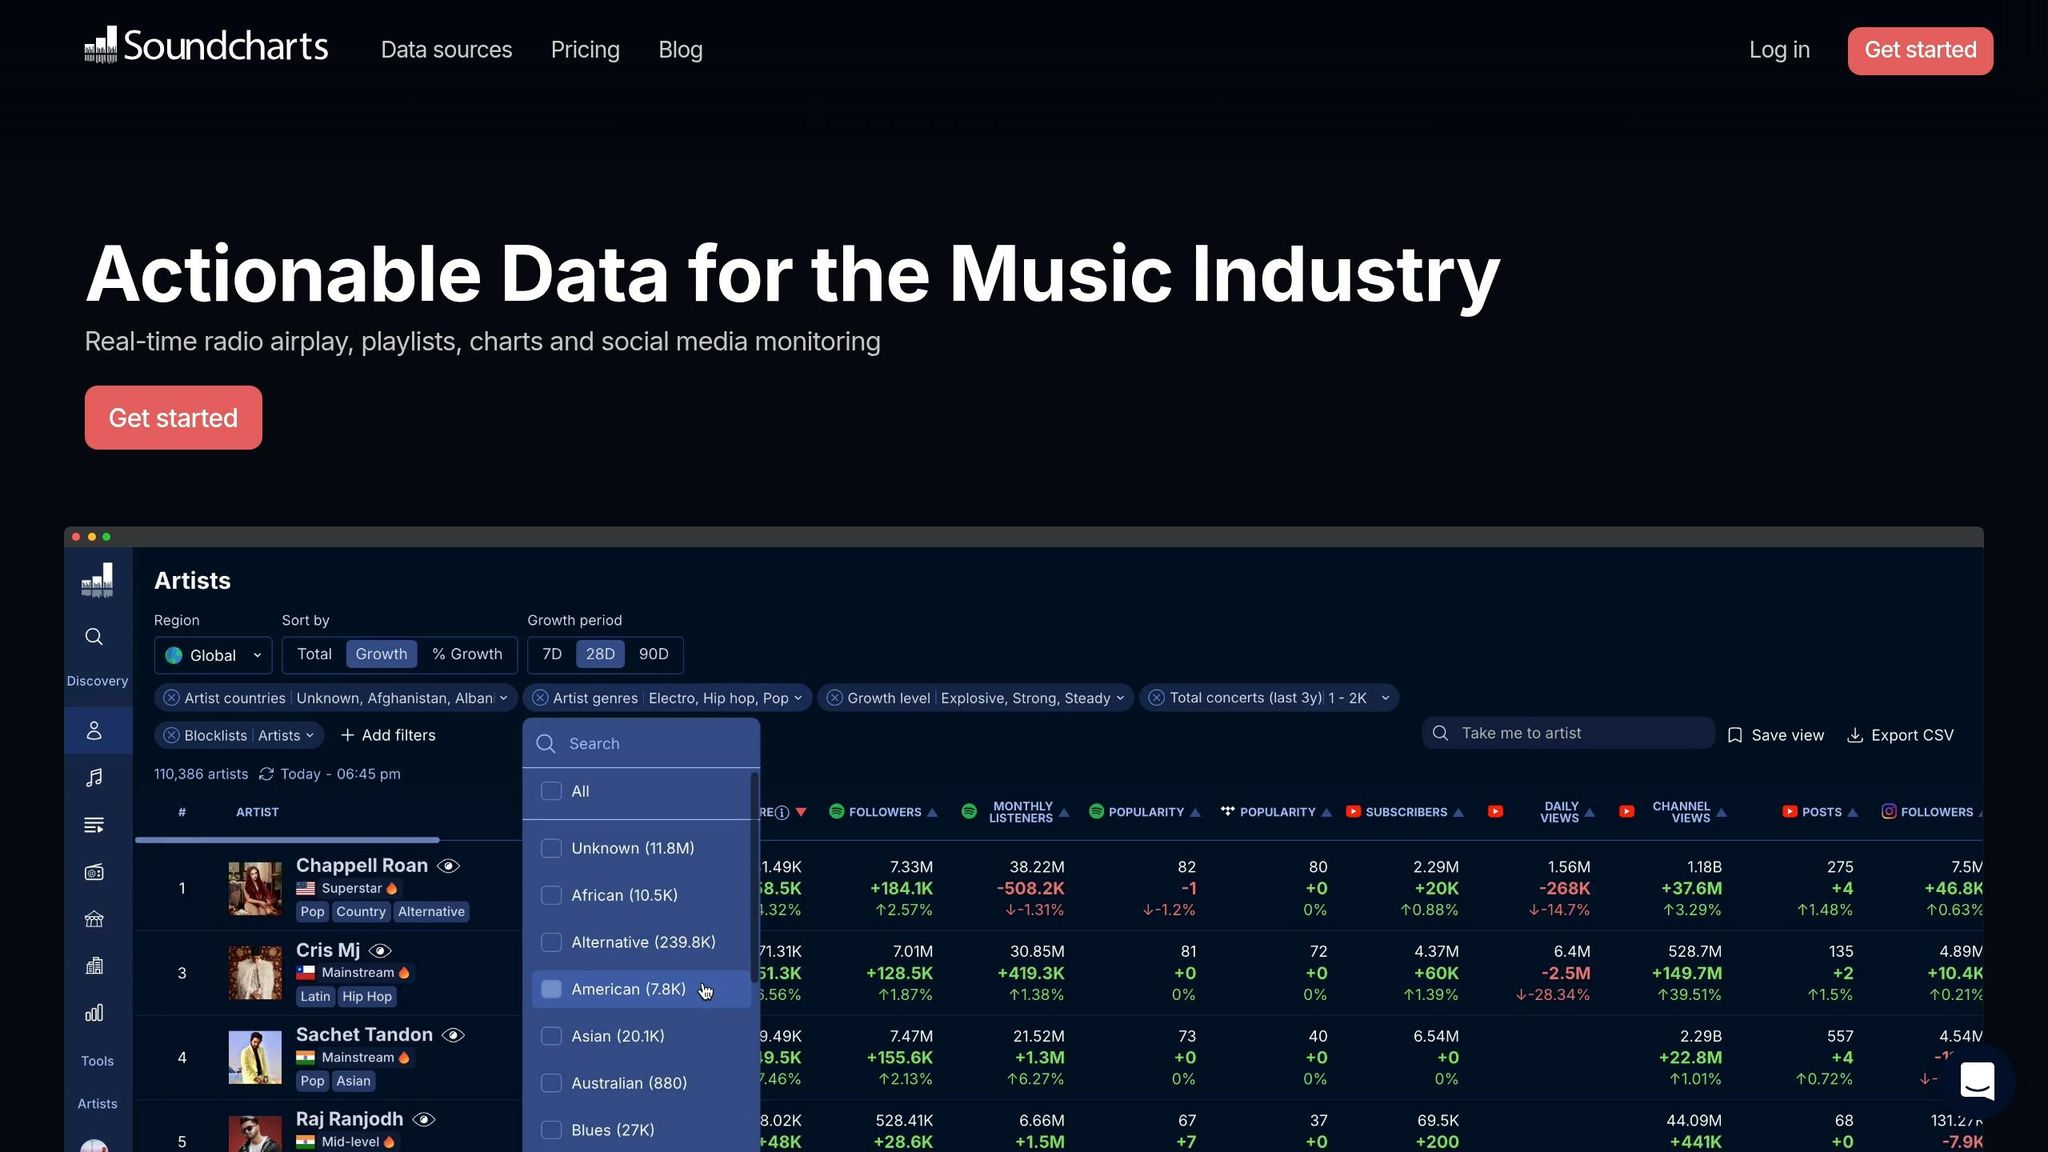
Cost: $10/month for 1 artist, $49/month for up to 10 artists, and $129/month for the Pro plan with unlimited artists plus advanced market features. There’s also a 7-day free trial.
Soundcharts is a cross-platform analytics dashboard that tracks streaming, social media, radio, and chart data in real time. It covers more than 2,465 terrestrial AM/FM stations across 87+ countries, which gives artists a clearer picture of where their music is moving. That matters when you're deciding where to spend on ads, how to promote a single release, or how to route upcoming shows.
One of its most useful features is the radio archive. You can see where airplay builds over time. That station-by-station history makes it easier to time promo, spot breakout markets early, and line up shows in places where momentum is already starting to build.
Soundcharts also sends custom alerts for playlist adds, chart entries, and spikes in engagement, so you can react fast when a track starts picking up steam.
The entry plan works for one artist, while the higher tiers make more sense for teams handling several artists or multiple markets at once. Next, compare update speed, data sources, and pricing before you pay.
7. PromoLinks.me
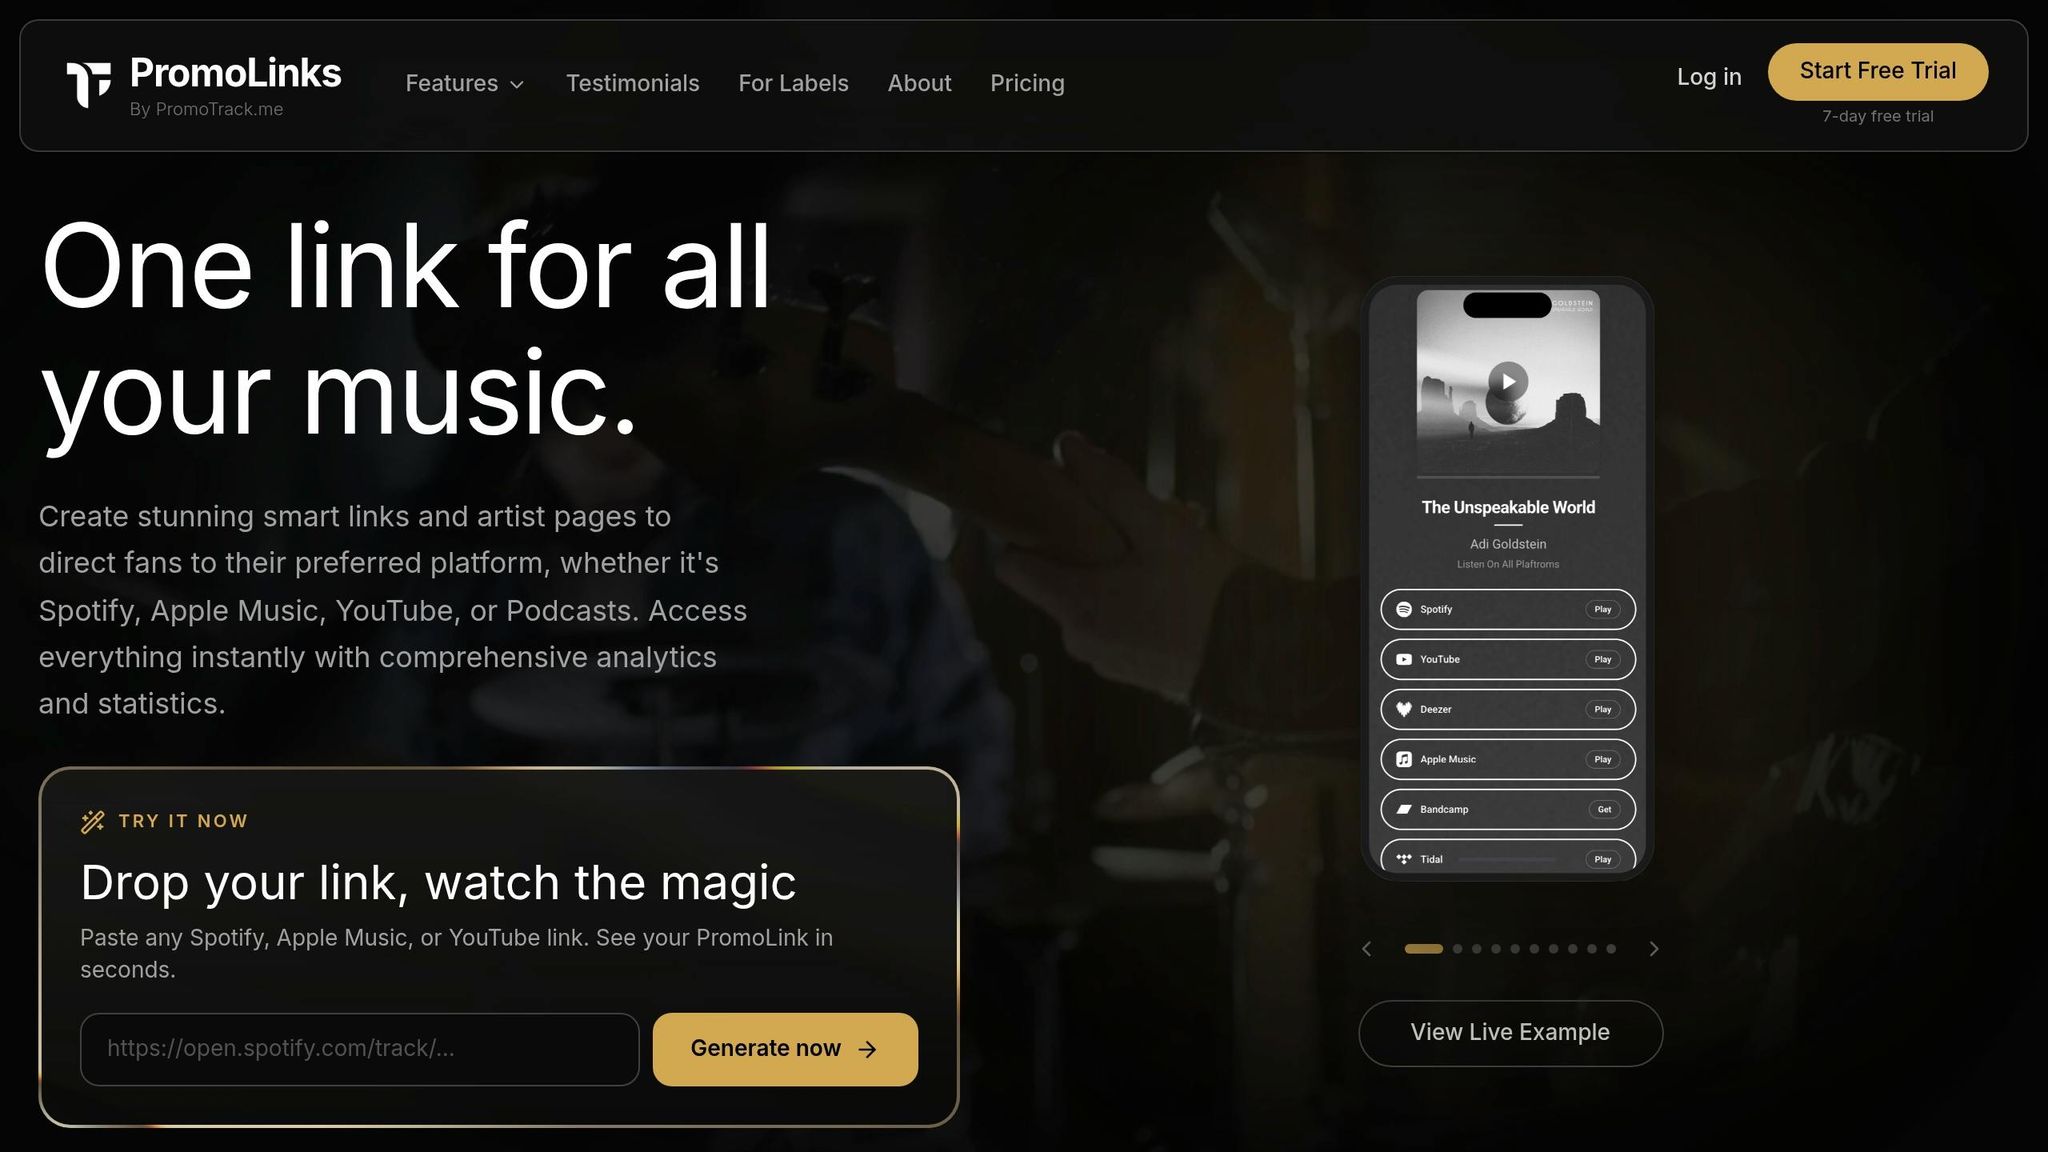
Cost: Indie is $7/month billed annually, Pro is $15/month billed annually, and Manager is $31/month billed annually.
Once you’ve tracked streams and listeners, the next step is simple: figure out which promo work is actually moving people to click, save, and engage. That’s where PromoLinks.me comes in.
PromoLinks.me is built around campaign analytics. It shows which links get clicks and where that traffic comes from, so you’re not left guessing. If you’re posting across a few channels, that kind of visibility matters.
Its smart links and pre-save pages track:
- traffic source
- device
- location data
That makes it easier to compare how Instagram stacks up against TikTok, see where your audience is clustered, and make sharper calls on your next promo push.
There’s also a nice offline angle here. You can use QR codes to track scans from posters, flyers, and merch tables. On top of that, you can collect emails from those same links, which helps you build a list you own for future ticket drops and merch sales.
| Plan | Price (Billed Annually) | Best For |
|---|---|---|
| Indie | $7/month | Solo independent artists |
| Pro | $15/month | Growing artists who want full analytics history |
| Manager | $31/month | Teams or managers handling multiple artist profiles |
Indie includes 7 days of history. Pro includes full history.
Next, compare these seven tools by data source, update speed, use case, and cost.
How to Compare These 7 Tools Before You Pay
After you review each tool, compare them based on the decision each one helps you make. More data points sound nice, but they only matter if they change your next move.
The free tools rely on first-party data. The paid options pull together public signals from more than one platform.
Comparison Table: Data Sources, Update Speed, Use Case, and Cost
| Tool | Data Sources | Update Speed | Best Use Case | Starting Price |
|---|---|---|---|---|
| Spotify for Artists | Spotify only | Daily | Fan engagement, playlist pitching | Free |
| Apple Music for Artists | Apple Music, Shazam | Daily | Shazam and local demand signals | Free |
| YouTube Analytics for Artists | YouTube, Shorts | Daily | Video performance, UGC tracking | Free |
| Songstats | 20+ platforms | Near real-time | Chart tracking, push notifications | ~$13/mo |
| Viberate | Streaming, social, live | Daily | Benchmark against similar artists | ~$20/mo |
| Soundcharts | Streaming, social, radio | Daily | Radio airplay and press reporting | $10/mo |
| PromoLinks.me | Campaign links, pre-saves | Near real-time | Track clicks, pre-saves, and emails | $7/mo |
Which Tool Fits Your Stage as an Artist
Your stage as an artist should shape what you pay for.
Early-stage artists: Stick with the free dashboards until you need cross-platform patterns or campaign attribution.
Growing artists: Add one aggregator when you need faster visibility across platforms.
Active marketers: Use a campaign tool when you need to see which links, QR codes, or pre-saves convert.
Once you pick the right layer, you can use the data to steer releases, ads, and show markets.
How to Turn Analytics Data Into Revenue
The tools above only matter if they change how you spend, where you show up, and what you push next.
Use Stream and Audience Data to Plan Releases, Ads, and Shows
Raw stream counts don't tell you where to put money next. The numbers tied most closely to revenue are saves, repeat listeners, playlist adds, and follower growth because they show intent, not just passive exposure.
Use Spotify for Artists save-to-listener ratio and top-city data to pick ad markets and show dates. If the same city keeps showing up in your top markets, that's a strong signal. That's where your next Meta or TikTok ad should run, and it's probably where you should look at booking a show.
Apple Music for Artists adds one more layer with Shazam activity. Strong Shazam data in a certain city can point to offline interest before streams start climbing. That gives you a chance to put local promo behind that market before the wave hits.
Apply the same thinking to campaign links: track the click only if it leads to a fan action.
Use Campaign Data to Measure What Actually Converts
Clicks matter only when they turn into pre-saves, emails, or sales. In a campaign, the numbers that count are pre-save rate, email captures, and cost per pre-save, email capture, or ticket click. Pre-saves show how many people cared enough to act before release day. capture fan emails without a website to build a list you own, which matters a lot when platform algorithms shift.
Use PromoLinks.me real-time analytics to move spend toward links that drive pre-saves, email captures, and ticket clicks. Then compare those actions against cost so you can back the channels that convert.
Conclusion: Pick the Right Analytics Tools for Where You Are Now
Start with free native dashboards. When you’re managing more than one platform, add cross-platform reporting. If you’re running paid campaigns, add link-level attribution.
That makes the choice less about feature lists and more about the next call you need to make.
A tool matters only if it changes your next decision before the release window closes.
Stage matters more than feature count. Put your attention on the metrics tied closest to revenue: save rate, listener-to-follower ratio, pre-saves, and email captures.
Here’s why those numbers matter:
- Save rate helps you judge release timing
- Listener-to-follower ratio shows fan depth
- Pre-saves and email captures show campaign value before release day
For campaign tracking, focus on conversion, not clicks. Use PromoLinks.me real-time analytics to track pre-saves and email captures, then move spend toward the links that convert.
Platform data, cross-platform context, and link-level attribution turn analytics into revenue decisions.
FAQs
Which metrics matter most for making more money from my music?
Focus on the numbers that show commitment and discovery, not just raw stream totals.
- Unique listeners show your actual audience size
- Saves, shares, playlist adds, and placements point to fan interest and how people are finding your music
- Geographic and demographic data help you make smarter marketing moves and plan live shows in the right places
PromoLinks.me can also help you collect fan email addresses and support your promo efforts, so passive listeners can turn into a more dedicated community.
When should I move from free dashboards to a paid analytics tool?
Consider switching when the time you spend tracking data by hand costs more than $15–$40 per month.
Paid tools make sense if you:
- manage multiple artists or competitors
- need real-time alerts
- share reports with a team
- want cross-platform insights
For most independent artists, free portals are enough until your needs get more complex.
How can I use analytics to choose the best cities for ads and shows?
Review your geographic listener data to see where your audience is already concentrated. Start with the audience location reports in your platform dashboards. Then look for cities with high listener counts. Those places already show stronger engagement, so you're not guessing in the dark.
For ads, compare listener locations with your current ad spend. That side-by-side view can help you spot high-performing markets and move more budget toward cities that bring a better return on investment.
Related Blog Posts
Ready to create your smart links?
Join thousands of artists using PromoLinks to promote their music smarter.
Get Started Free