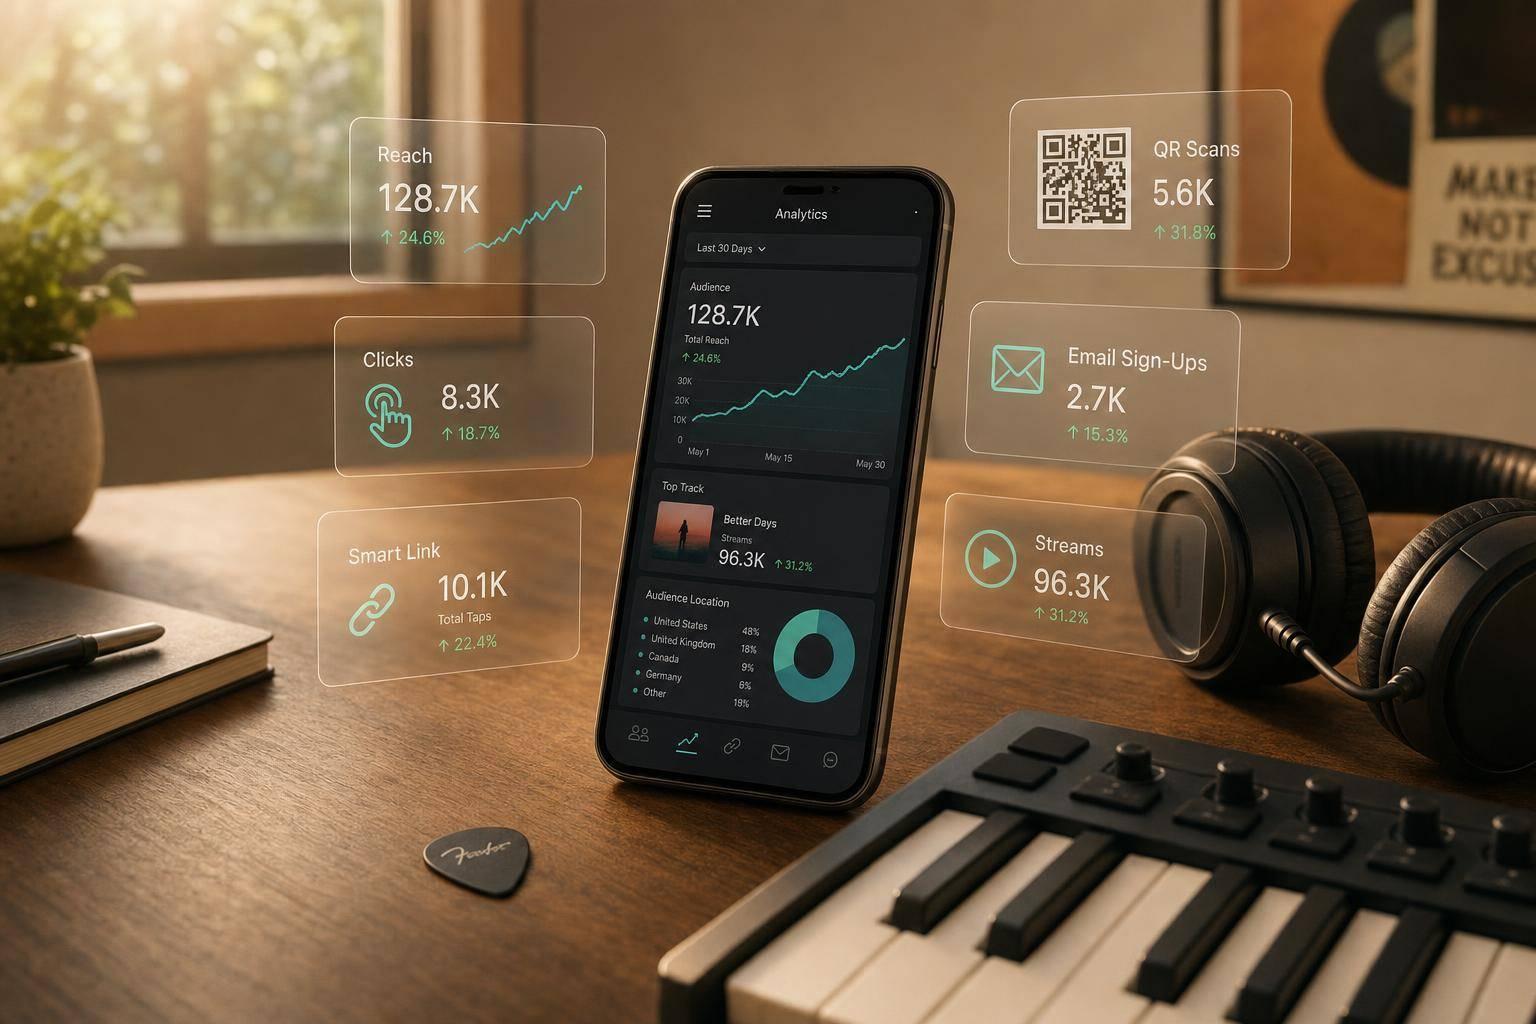
Social Media Analytics Tools for Musicians
If I want to know whether social media worked, I don’t stop at likes. I track what happened after the post: clicks, streams, pre-saves, email sign-ups, and sales.
That’s the whole point of music campaign tracking. A post can get high reach and still do little for a release. A smaller post can send more fans to Spotify, a pre-save page, or an email form. So I look at music analytics that matter as a simple path: post → click → action.
Here’s the short version:
- Native social dashboards show who saw the post, who stayed, and who clicked.
- Smart link analytics show where fans went after the click.
- QR tracking shows what came from posters, merch tables, and venue signs.
- Email data shows which sources brought subscribers, not just traffic.
A few numbers matter most each week:
- Reach and impressions
- Clicks and CTR
- Watch time or completion rate
- Smart link destination clicks
- QR scans
- Email sign-ups
- Streams or pre-saves
I’d also tag links with UTM parameters so I can compare Instagram, TikTok, YouTube, paid ads, and QR placements in one view. Then I’d keep a simple weekly sheet with campaign name, spend in USD, reach, clicks, scans, sign-ups, and stream lift.
One stat from the article stands out: on Zach Bryan’s Quittin' Time Tour, QR codes across merch and tickets brought in 152,000+ fan emails, including 74,000+ new leads. That shows why off-platform tracking matters.
Bottom line: I’d use social dashboards for top-of-funnel numbers, smart links for click behavior, QR codes for offline response, and email data for owned audience growth. Then I’d review all of it once a week for 15 to 30 minutes and shift time or budget to the sources that lead to action.
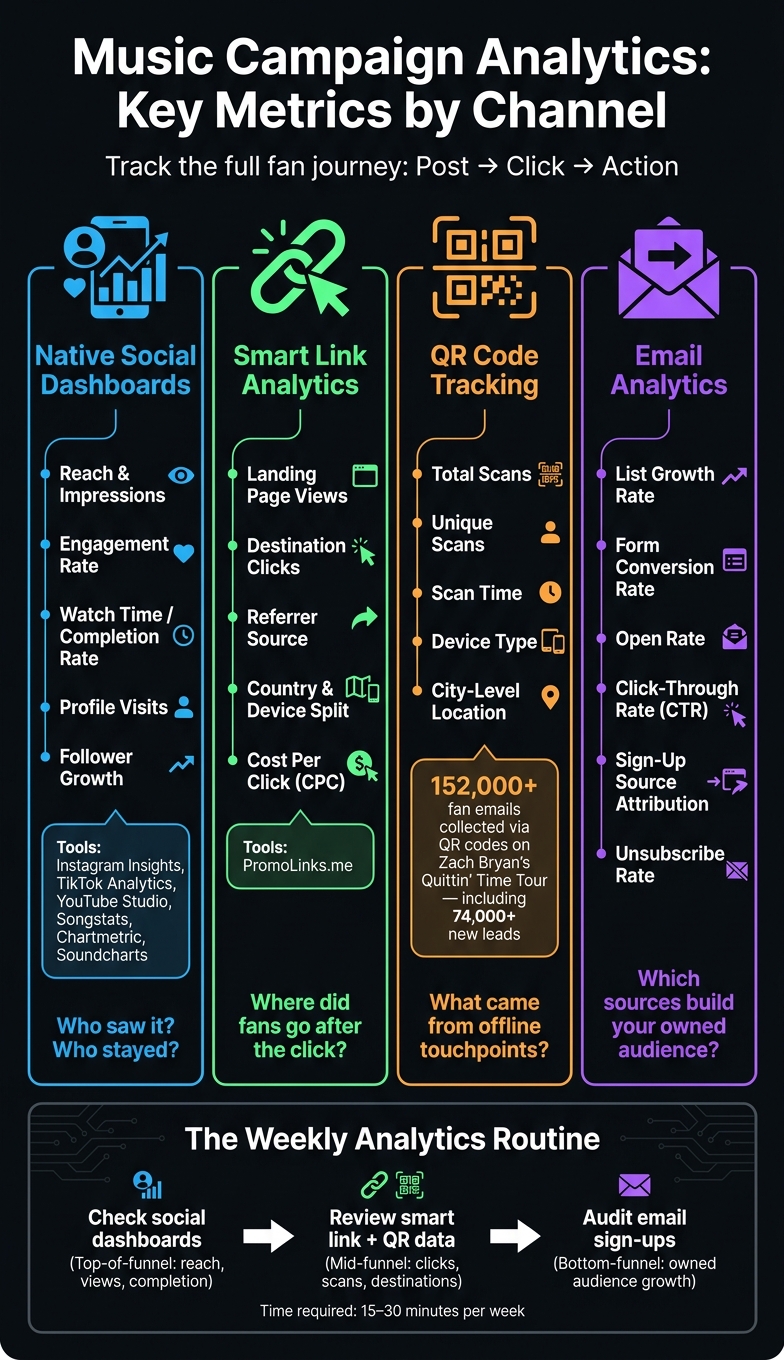
Music Campaign Analytics: Key Metrics by Channel
How to Actually Use Analytics as a Musician
Understanding these metrics is the first step toward making data-driven decisions. To dive deeper, learn what to track in real-time to optimize your release strategy.
sbb-itb-e819543
Native Social Dashboards Musicians Should Check First
Start with the dashboards built into the platforms you already use. They give you a first read on campaign performance without adding more tools to the stack.
These dashboards help answer three simple questions: who saw it, who stayed, and who clicked. Check what happened on-platform first, then compare that with your link data.
Instagram Insights and Meta Business Suite
Instagram Insights shows reach, engagement, profile visits, and follower growth. When promoting a single release, pay the most attention to reach and profile visits. That tells you how far the post spread and whether it pushed people to check out your profile.
It helps to log these numbers each month. Over time, you can compare release cycles and spot growth trends instead of judging each post in isolation.
Tag your bio and Story links with ?utm_source=instagram so you can confirm Instagram traffic in your link analytics.
TikTok Analytics and YouTube Studio
Short-form video dashboards tell you more than how many people showed up. They show whether people actually stuck around.
TikTok Analytics tracks views, watch time, completion rate, audience retention, and traffic sources. For music campaigns, completion rate often matters more than raw views. A big view count can look nice, but completion rate shows whether people stayed with the video.
YouTube Studio tracks views, watch time, audience retention, and subscriber growth. Its audience retention graph shows where viewers drop off. That makes it easier to adjust your intro, tighten pacing, and move your CTA to a better spot.
Cross-Platform Dashboards for Managers and Labels
If you're managing more than one artist or running campaigns across several territories, checking each native dashboard one by one gets old fast.
Tools like Songstats, Chartmetric, and Soundcharts pull data from Spotify, Apple Music, YouTube, Instagram, and TikTok into one view. That makes reporting faster and helps with real-time tracking.
Chartmetric works well for labels that need competitive intelligence and peer benchmarking. Songstats fits individual artists who want real-time playlist alerts and a phone-friendly workflow.
Once you know which posts did well on-platform, match those results to the click data from your shareable music links.
Smart Link Analytics That Show Where Fans Actually Go
Smart link analytics show what fans do after the click. Once you know what worked on-platform, smart links help you see what those fans picked next.
Key Smart Link Metrics for Release Campaigns
The main numbers to watch are landing-page views, destination clicks, referrer data, and country and device splits. Destination clicks show which streaming service fans pick in practice. That should shape both pitching and ad spend. Country and device splits show if your traffic is U.S.-based or international, and whether fans are mostly on mobile.
Referrer comparison is where things get interesting. An Instagram Story might send less traffic than a TikTok post, but still drive a bigger share of Spotify clicks and email sign-ups. If that happens, the Instagram traffic may be worth more, even if the top-line visit count looks smaller.
Put simply: volume and intent are not the same thing.
Using PromoLinks.me for Links, QR Codes, and Fan Capture
PromoLinks.me is built for this exact workflow. It brings smart links, pre-saves, QR codes, event pages, and fan email capture into one dashboard.
That email capture piece matters a lot. It moves fans from platform-led clicks into an audience you can reach later for the next release, tour date, or merch drop, without leaning so hard on an algorithm.
Connecting Smart Link Data With Ad Spend and Post Performance
UTM parameters connect your ad dashboards to your smart link data. When you tag each post or ad with its own UTM, like ?utm_source=tiktok&utm_campaign=summer-drop, you can compare traffic sources side by side in your smart link dashboard.
That makes it much easier to see which sources drove streams, saves, or sign-ups, instead of just empty clicks.
Look at these numbers together, not in isolation:
| Metric | Source | What It Shows |
|---|---|---|
| Impressions / Reach | Meta, TikTok | How many people saw the post or ad |
| Clicks / CTR | Social & Smart Link | Whether the creative drove initial interest |
| Cost Per Click (CPC) | Ad Dashboard | Dollar efficiency of paid spend |
| Smart link clicks | Smart Link Analytics | Fans ready to stream, save, or sign up |
| Platform Split | Smart Link Analytics | Which streaming service fans actually prefer |
| Email sign-ups | Smart Link / Pre-save | Fans who moved into your owned audience |
When you review spend, clicks, and conversions in one view, you can spot the weak point faster. Maybe the post didn’t get attention. Maybe the landing page lost people. Or maybe the audience itself wasn’t the right fit.
QR Code and Email Analytics in the Same Campaign Funnel
Social and smart link data only shows part of music promotion across platforms. If you’re playing shows, hanging posters, or selling merch face-to-face, you also need a way to track offline response. That’s where QR scans and email sign-ups come in. They fill in the gaps that social clicks leave behind.
Tracking QR Scans From Posters, Merch Tables, and Venue Signage
Use a different QR code for each placement, like a venue poster, merch table, or stage banner, so you can compare performance by spot. The main metrics to watch are scan count, unique scans, time, device, and location.
Here’s why each one matters:
- Unique scans give you an estimate of how many different people engaged.
- Total scans show overall activity.
- Scan time helps you see when fans are most likely to take action.
- Device type helps you keep the landing page mobile-first.
- City-level location data shows which venues drive the strongest response.
For Zach Bryan's Quittin' Time Tour, QR codes placed across merchandise and tickets collected over 152,000 fan emails, including 74,000+ new leads added to the CRM. That’s not a social stat. It’s a direct contact list built from in-person touchpoints.
Tag each QR destination by placement so the scan data feeds into the same dashboard. Once you do that, offline traffic sits right next to your social and smart-link data instead of living in a separate silo.
Email Sign-Up Metrics That Matter for Artists
Email is the one channel where you fully own the audience. No algorithm decides how many subscribers get your message. That’s why list quality matters more than pure list size.
The metrics worth checking on a regular basis are list growth, form conversion rate, open rate, click-through rate (CTR), unsubscribe rate, and sign-up source attribution. Open rate shows whether fans are seeing your emails. CTR shows whether they’re taking action. Sign-up source attribution shows which channels bring in the most engaged fans.
For example, subscribers who join through a live show QR code often open emails at a higher rate than subscribers who came from a paid ad. That gap should shape where you put more effort next time.
Connecting QR Traffic to Email Capture and Smart Links
A fan scans a QR code, lands on a mobile page, then either streams or signs up. Each step can be measured, and each one tells you something different.
Fan scans QR → lands on a mobile page → streams or signs up.
PromoLinks.me can keep QR, link, and email data in one dashboard. That makes it easier to see how many fans from a specific show scanned a QR code, how many reached the page, and how many signed up versus clicked through to Spotify.
That split matters. Some placements drive streams. Others drive email sign-ups. When you can see that side by side, it gets much easier to decide which placements deserve more attention in the next campaign cycle.
Conclusion: Build a Simple Weekly Analytics Routine
These tools only matter if you check them together on a set schedule. A weekly review takes 15 to 30 minutes and turns a pile of numbers into clear choices. That weekly check is what ties social performance to actual fan action.
Track only the metrics that push fans toward streams, sign-ups, or ticket sales as part of your music marketing checklist.
The Minimum Dashboard to Maintain
You don’t need anything fancy to start. A simple spreadsheet with one row per campaign is enough. Update it on the same day each week, and focus on the columns that tie social activity to actual results.
Use this as your minimum weekly report. These columns help you see whether a post, QR code, or smart link moved fans farther down the funnel.
| Column | What to Track |
|---|---|
| Date | Campaign start date (MM/DD/YYYY format) |
| Platform | Instagram, TikTok, YouTube, Email, or offline QR sources such as venue posters and merch tables |
| Post / Campaign Name | e.g., "Single pre-save Reel", "Tour announcement TikTok" |
| Spend (USD) | Ad budget for that campaign; log $0.00 for organic posts |
| Reach | Unique accounts or viewers who saw the content |
| Clicks | Link clicks from posts, smart links, or QR scans combined |
| QR Scans | Scans from posters, merch tables, or venue signage |
| Email Sign-ups | New subscribers captured through smart-link pages, pre-save campaigns, or landing pages |
| Streams or pre-saves gained | Change in streams or pre-saves tied to the campaign |
PromoLinks.me puts smart links, QR scans, and email sign-ups in one view, which makes the weekly update faster.
Stick with the same dashboard for 4 to 6 weeks, then move budget toward the channels that convert.
FAQs
Which metrics matter most for musicians?
Focus on actionable metrics, not vanity numbers like total streams or follower counts.
The big ones to watch are save rate, stream velocity, CTR, and algorithmic stream sources. A good benchmark for save rate is 5% or higher. And algorithmic sources should account for about 40% of total streams.
Why does this matter? Because big surface-level numbers can look nice, but they don’t always tell you if a song is building momentum. Save rate shows whether people care enough to come back. Stream velocity shows how fast interest is building. CTR tells you if people are clicking in the first place. And algorithmic streams can show whether platforms are starting to push your music on their own.
You should also track fan conversion data through PromoLinks.me, including emails and pre-saves. That gives you audience data you actually own, instead of relying only on social platforms.
How do UTM tags help track music campaigns?
UTM tags help you track music campaigns by adding extra parameters to your URLs, like an Instagram source tag.
That means you can use different tags for social channels, email campaigns, and QR codes to see which sources drive the most traffic and engagement.
In the PromoLinks.me dashboard, this data shows your top-performing platforms in real time. So you can adjust your promo plan across Spotify, Apple Music, and YouTube based on what’s actually working.
How can I measure offline promotion with QR codes?
Use PromoLinks.me’s built-in QR code generator to make scannable links for posters, flyers, and merchandise. Before you create each code, add distinct UTM parameters so you can track which item led to the scan.
You can track total scans, unique visitors, location data, and device types in real time. And because the codes are dynamic, you can change the destination URL later without reprinting your materials.
Related Blog Posts
Ready to create your smart links?
Join thousands of artists using PromoLinks to promote their music smarter.
Get Started Free