2026 Streaming Payout Data: Key Trends for Artists
More streams do not always mean more money. If I were planning releases for 2026, I’d focus on where the streams come from, which platform they happen on, and whether listeners use paid or free tiers.
Here’s the short version:
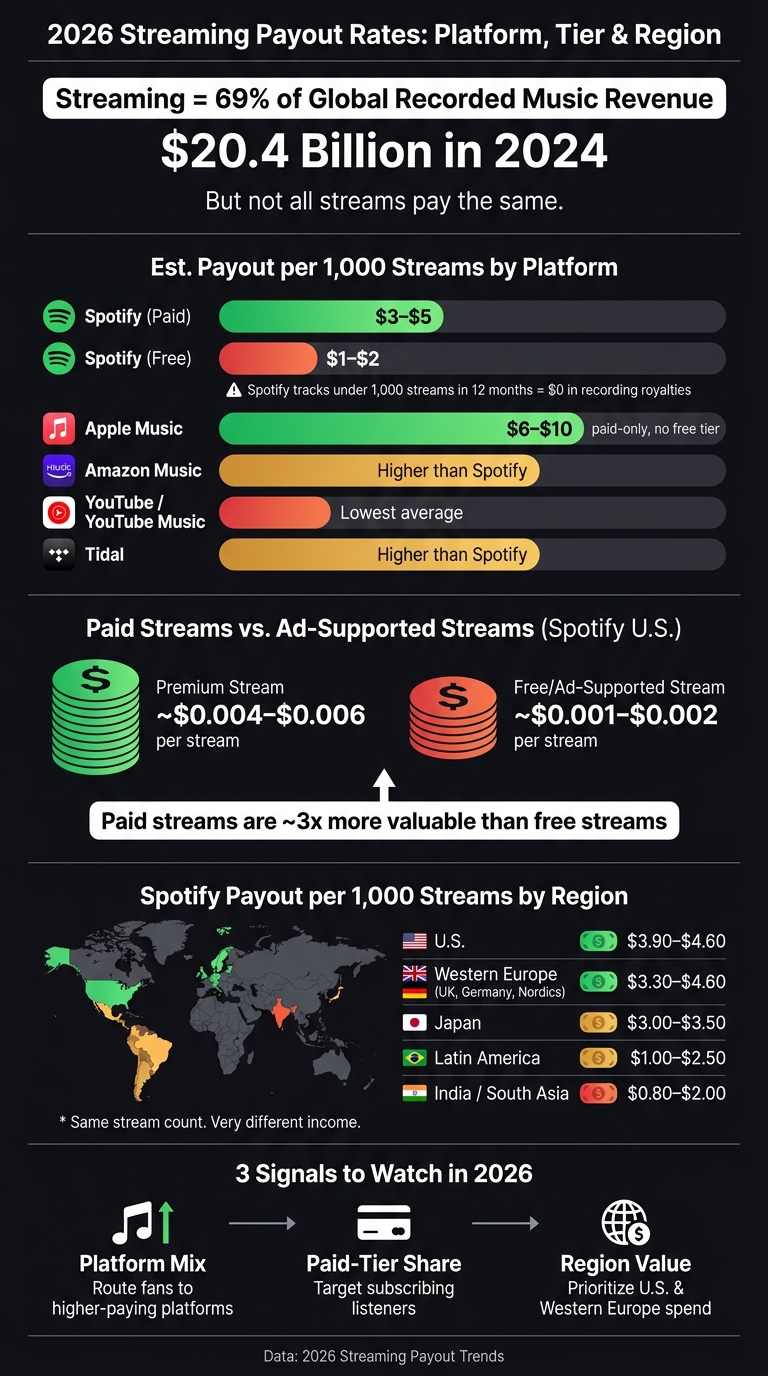
- Streaming is about 69% of global recorded music revenue, with revenue above $20.4 billion.
- Spotify often lands around $3 to $5 per 1,000 streams, while Apple Music often lands around $6 to $10 per 1,000 streams.
- Paid listeners are worth more than free listeners. On Spotify, Premium streams can pay about 3x more than free streams.
- Geography changes payouts. A U.S. Spotify stream can be worth about $0.0039 to $0.0046, while some lower-price markets may land near $0.0008 to $0.0025.
- Spotify’s 1,000-stream rule matters. If a track stays under 1,000 streams in the prior 12 months, it earns $0 in recording royalties on Spotify.
If I had to boil the article down to one point, it would be this: I’d put promo money into paid-heavy platforms, higher-paying countries, and fewer tracks with a better shot at clearing Spotify’s floor.
2026 Streaming Payout Rates by Platform, Tier & Region
How Much Spotify Really Pays Per Stream In 2026?
To maximize your earnings, consider using music promotion tools for independent artists to grow your listener base.
sbb-itb-e819543
Quick Comparison
| Factor | What I’d watch | Why it matters |
|---|---|---|
| Platform | Spotify vs. Apple Music vs. YouTube | Per-stream value can vary a lot |
| Listener tier | Paid vs. free | Paid streams often pay much more |
| Region | U.S./Western Europe vs. lower-ARPU markets | Same stream count can mean very different income |
| Catalog size | Fewer tracks vs. many low-play tracks | Low-stream songs may earn nothing on Spotify |
| Promo routing | Which service fans land on | Better routing can change revenue per listener |
In other words: I wouldn’t judge a campaign by stream count alone. I’d judge it by platform mix, paid-tier share, and country-level payout value. This data is essential when planning how to promote a single release to maximize revenue.
The 2026 Streaming Payout Landscape
Streaming crossed $20.4 billion in global revenue in 2024, making up 69% of all recorded-music income. But not all streams are worth the same. The highest-value listening still tends to come from paid-heavy audiences in the U.S. and Western Europe.
That’s the part many artists miss: more streams doesn’t always mean more money. For independent artists, payout efficiency often matters more than raw volume. Paid-tier listening tends to drive revenue. Ad-supported listening tends to drive reach. So once you know that, the next step is pretty clear: look at which platforms, and which listeners, are doing the heavy lifting.
Average Payout Ranges By Platform
Actual earnings still shift based on territory, subscription tier, and platform fees. When following a music marketing checklist, the main question is simple: which platforms and listener types bring in the most per stream?
| Platform | Approx. Per-Stream Range | Est. Payout per 1,000 Streams | Listening Mix | Key Notes |
|---|---|---|---|---|
| Spotify | $0.003–$0.005 (paid); $0.001–$0.002 (free) | $2–$5 | Paid and free | Under 1,000 streams in the prior 12 months earns no recording royalties. |
| Apple Music | Typically higher than Spotify | Varies | Paid-heavy | Higher-value listening is concentrated in paid subscriptions. |
| Amazon Music | Typically higher than Spotify | Varies | Paid-heavy | Platform fees can reduce what reaches rights holders. |
| YouTube / YouTube Music | Lower on average due to ad-supported listening | Varies | Mixed, with significant ad-supported listening | Ad-supported listening pulls the average down. |
| Deezer | Varies by territory and plan mix | Varies | Mixed | Territory and subscription mix influence payout outcomes. |
| Tidal | Typically higher than Spotify | Varies | Paid-heavy | Paid listening tends to support stronger per-stream value. |
This spread hits hardest when your catalog is small or your audience leans ad-supported. A few thousand plays on one service can look a lot better than the same number somewhere else.
Minimum Stream Thresholds And Policy Changes Affecting Small Catalogs
In April 2024, Spotify implemented a 1,000-stream minimum threshold. If a track doesn’t hit 1,000 streams in the prior 12 months, it earns zero recording royalties on that platform.
That changes the math for smaller releases. If you put out singles often and some of them stall early, those tracks may pull in plays without paying anything. The same goes for older songs in a back catalog. A track can still get occasional listens and still earn zero if it stays under the line.
For many indie artists, this turns promotion into a focus game, not a volume game. It often makes more sense to push fewer songs hard enough to cross 1,000 streams within 12 months than to scatter effort across dozens of low-activity releases. This is where pre-save campaigns become essential for consolidating day-one engagement.
The next issue is how paid and ad-supported listening changes these averages.
Paid Tiers vs. Ad-Supported Streams: Why The Mix Matters
How people stream matters just as much as where they stream. If a listener pays for a subscription or uses a free plan, the same play can produce very different earnings. In short, tier mix still shapes the payout pool.
Premium vs. Free Listening Revenue In The U.S.
In the U.S., streaming revenue leans heavily toward paid subscriptions. The RIAA also separates "Free Streaming" from "Paid Subscriptions" as its own lower-value category. Spotify makes that gap easy to see: in the U.S., Premium streams are often estimated at $0.004 to $0.006, while Free streams usually land around $0.001 to $0.002. That's about a 3x difference.
That changes how you analyze campaign results. A smaller batch of premium plays can earn more than a much bigger pile of ad-supported plays.
How Platforms Differ In Ad-Supported Payouts
Not every platform handles free-tier money the same way. The clearest differences show up with Spotify, Apple Music, and YouTube.
Apple Music has no ad-supported tier, so every stream comes from a paying subscriber. That's one reason it's often cited as having higher average payouts per stream. YouTube sits on the other end. Its money is tied closely to ad inventory, video behavior, and engagement, which makes average per-stream payouts lower and less steady.
| Platform | Premium Tier Est. | Ad-Supported Est. | Notes |
|---|---|---|---|
| Spotify | ~$0.004–$0.006 | ~$0.001–$0.002 | Large free-tier base; paid streams are often about 3x more valuable |
| Apple Music | Often among the higher average payouts per stream | N/A - no free tier | All streams come from paying subscribers |
| YouTube / YouTube Music | Varies | Lower; tied to ad inventory | Ad-supported listening pulls the overall average down |
Ad-supported payouts also react strongly to region and user behavior. They tend to go up in stronger ad markets and when listening sessions are longer and more engaged. So audience geography and listener behavior aren't just discovery metrics. They're revenue metrics too.
These tier gaps can widen or shrink depending on the market, which is why geography matters next. Once regional payout differences enter the picture, the gap between paid and ad-supported listening matters even more.
Regional Payout Differences And Audience Value
Tier mix and geography stack on top of each other. Markets with more Premium users usually pay more than markets with heavier ad-supported listening. That means listener location has a direct effect on stream value, and the same song can earn very different amounts depending on where it’s played. On Spotify, a stream in the U.S. or Norway can pay much more than one in Brazil or India.
Why The U.S. And Western Europe Often Pay More Per Stream
The gap mostly comes down to three things: subscription pricing, paid-user share, and ARPU. In the U.S. and many Western European countries, individual Spotify Premium plans cost about $11–$13 per month, and more listeners pay for access instead of using the free tier. So regional payout data isn’t just nice to have. It can help shape where to focus.
Spotify’s 2026 market data makes the difference plain. U.S. streams are estimated at about $0.0039 to $0.0046 each, while Brazil and India often land closer to $0.0010 to $0.0020. Same stream count, different money.
| Region | Est. Spotify Rate per Stream | Per 1,000 Streams | Key Driver |
|---|---|---|---|
| U.S. | ~$0.0039–$0.0046 | ~$3.90–$4.60 | High ARPU; premium-heavy; strong ad market |
| Western Europe (U.K., Germany, Nordics) | ~$0.0033–$0.0046 | ~$3.30–$4.60 | Strong premium adoption; mature subscription behavior |
| Latin America | ~$0.0010–$0.0025 | ~$1.00–$2.50 | Fast-growing but lower ARPU; more ad-supported share |
| India / South Asia | ~$0.0008–$0.0020 | ~$0.80–$2.00 | High volume; low subscription pricing; high free usage |
| Japan | ~$0.0030–$0.0035 | ~$3.00–$3.50 | Mature market; relatively high ARPU |
How Regional Data Should Shape Artist Targeting
For indie artists, the takeaway is pretty direct: put money where each listener is worth more, then build reach in other places in a different way. Don’t look only at audience size. Look at where your current listeners produce the most revenue. Latin America can deliver a big audience, but the per-stream return is lower.
A smart two-tier plan looks like this:
- put paid promotion and release-day budget into higher-value markets using custom domains for artist branding like the U.S., U.K., Germany, Canada, and the Nordics.
- Use organic growth and local collabs in growth markets such as Latin America and South and Southeast Asia, without paid spend.
Before you decide where to push next, check where your listeners already are and what those streams are worth.
What The Numbers Mean For Independent Artist Promo Plans In 2026
Once you factor in regional gaps and listener tiers, payout data starts to shape promo decisions in a very direct way. The spread between Spotify and Amazon Music makes one thing clear: where your listeners stream matters just as much as how many streams you get.
Release And Catalog Planning Based On Revenue Patterns
Release planning isn't just about picking a date anymore. It's a revenue call.
Put more promo behind tracks that already pull in premium-tier listeners and repeat plays. Aim campaigns at premium-heavy audiences in stronger-paying markets. And don't split your budget across a pile of weak tracks, especially with Spotify's 1,000-stream floor. You can use a Spotify royalties calculator to see how these thresholds impact your bottom line.
For new releases, build early traction in premium-heavy markets like the U.S. and Western Europe, where each stream is worth more from the start. Then connect each release to your back catalog. That way, when someone finds the new song, they have a clear path to older tracks that already do well. More paths into your catalog can mean more repeat listening.
Using PromoLinks.me To Track Higher-Value Traffic And Listening Behavior
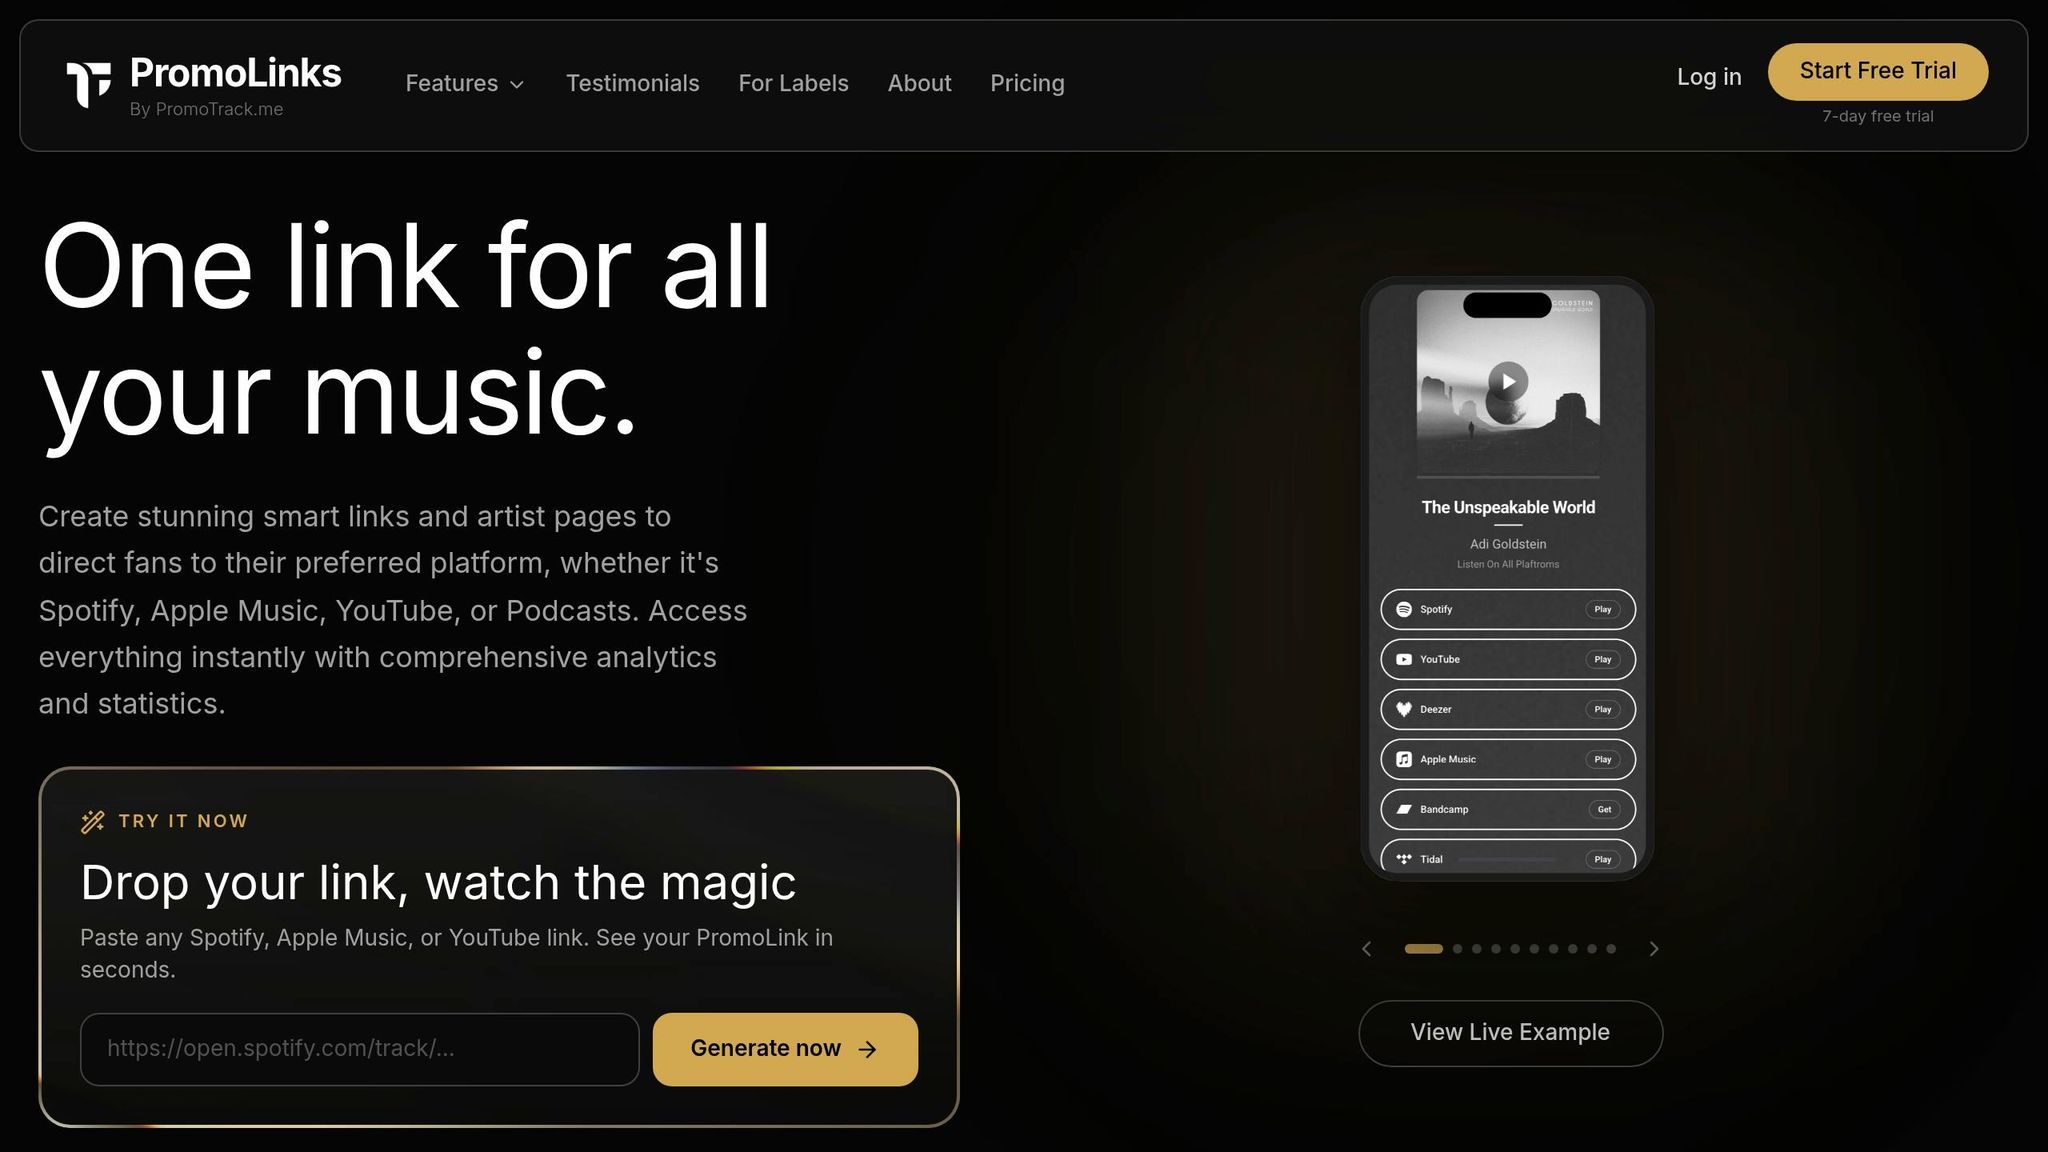
To make those payout gaps useful, you need tracking that shows where your better listeners come from. PromoLinks.me lets artists run smart links, pre-saves, QR codes, and fan email capture while tracking which regions and platforms convert best.
If your data shows strong click-through from a higher-value market but weak follow-through on one platform, you can change the destination and tighten the messaging before release day. Pre-save campaigns matter here too. They can help drive day-one streams, and those early streams can feed algorithmic signals while they still count.
Key 2026 Payout Signals Artists Should Watch
In 2026, the best promo plans follow revenue, not just reach.
Watch these three signals:
- Platform routing changes revenue. Apple Music and Amazon Music both pay more on average per stream than Spotify, so broad distribution alone won't do much if you aren't actively sending fans to higher-value destinations.
- Paid-tier listeners often bring stronger returns, so it's smarter to target subscribing fans than chase raw stream volume.
- Regional data should shape budget decisions. A smaller U.S. audience can beat a much bigger audience in a lower-paying market.
Track listener location, platform split, and save rate. Then move spend when those numbers shift.
FAQs
How can I tell which streams earn the most?
Check two main factors: listener location and subscription tier. Premium streams usually earn 3 to 4 times more than free, ad-supported streams.
Payouts are based on the listener’s country, not yours. Markets with higher subscription prices, like the U.S. or Norway, generally pay more per stream than emerging markets. PromoLinks.me can help you track geographic and platform data.
Should I focus promo on fewer songs in 2026?
Not necessarily. The 2026 data points more to a steady release cadence than to pushing fewer songs.
A waterfall strategy - putting out singles every 4 to 6 weeks - can help keep your music in Spotify’s Release Radar and help build algorithmic momentum. PromoLinks.me can simplify smart links and pre-save campaigns for each release.
Do free-tier listeners still help if payouts are lower?
Yes. Free-tier listeners still matter because they help with discovery.
Ad-supported streams pay less than premium streams. But they can put your music in front of new people who may not have found you otherwise. Over time, some of those listeners may follow your profile, save your tracks, and later turn into higher-paying premium streams.
Related Blog Posts
Ready to create your smart links?
Join thousands of artists using PromoLinks to promote their music smarter.
Get Started Free