
Event Email Metrics: Opens, Clicks, Sales
Event Email Metrics: Opens, Clicks, Sales
If I judge an event email by open rate alone, I miss the part that matters most: ticket sales. The clearest way to read performance is to track opens, clicks, and sales together.
Here’s the short version:
- Opens show whether people noticed the email
- Clicks show whether they wanted to check the event
- Sales show whether that interest turned into ticket demand
A simple benchmark check helps:
- Open rate: about 32%–43% for many email programs, around 46% for entertainment and events
- CTR: 1%–2% is weak, 2%–4% is average, 4%–7%+ is strong
- CTOR: under 10% is weak, 10%–20% is solid, 20%+ is strong
- Delivered-email conversion: often around 1% can still mean a send worked
- Click-to-sale conversion: around 10%–20% can show the ticket page is doing its job
I’d read the funnel like this:
- High opens + low clicks = people noticed it, but the email did not move them
- Average opens + strong clicks = the right people opened
- Clicks + low sales = the ticket page, price, or checkout may be the issue
- Low numbers across all three = list quality, targeting, timing, or market fit may be off
Open data is also less clean now because of privacy tools and bot activity. This makes it even more critical to capture fan emails through reliable, direct channels. So if I want a better read on fan interest, I put more weight on clicks, conversions, and ticket revenue.
A few email types also change what “good” looks like:
- Standard artist emails usually get lower opens and clicks
- Local pre-event sends often do better because they are time-based and city-specific
- Last-chance reminders can turn clicks into sales at a higher rate
- Post-event emails may get solid engagement, even if sales are not the goal
Here’s a fast comparison:
| Metric | What it tells me | Good range to watch |
|---|---|---|
| Open rate | Did people notice the email? | 30%+ broad send, 40%–50% local segment |
| CTR | Did delivered emails drive action? | 2%–4% average, 4%–7%+ strong |
| CTOR | Did openers click? | 10%–20% solid, 20%+ strong |
| Delivered conversion | Did the send produce buyers? | Often around 1% or more |
| Click-to-sale conversion | Did the ticket page close buyers? | Often 10%–20% |
If I want to improve event email results, I don’t just ask, “What was the open rate?” I ask: How many people opened, how many clicked, and how many bought?
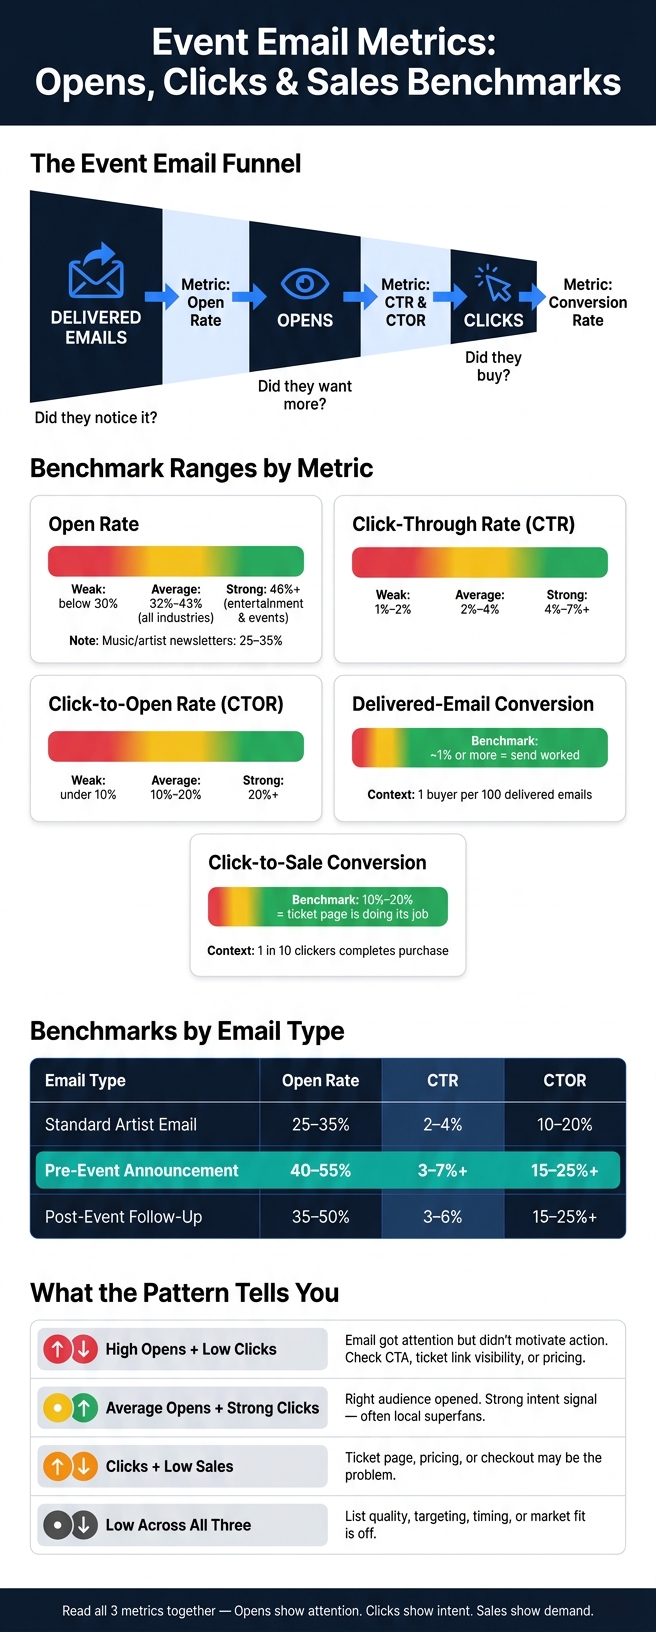
Event Email Metrics: Opens, Clicks & Sales Benchmarks at a Glance
The Core Event Email Metrics, Defined
Open Rate, Click Rate, Click-to-Open Rate, and Conversion Rate
These four metrics do most of the heavy lifting in event email campaigns.
Open rate is the percentage of delivered emails that got opened at least once. The formula is unique opens ÷ delivered emails × 100. Say you send a tour announcement to 10,000 fans, 500 bounce, and 2,850 people open it. Your open rate comes out to about 30%.
Click-through rate (CTR) is the percentage of delivered emails that led to at least one click. Using that same example, if 475 of those 9,500 delivered emails get a click, your CTR is about 5%. This is your first solid sign that people may be ready to buy tickets.
Click-to-open rate (CTOR) looks at a narrower group: the people who opened the email. It asks how many of them clicked. The formula is unique clickers ÷ unique opens × 100. With 2,850 opens and 475 clicks, CTOR is about 16.7%. That helps you judge how well the message, offer, and CTA pushed openers to act.
Conversion rate tracks ticket sales. You can look at it in two ways, and both tell you something useful.
- Delivered-email conversion = ticket buyers ÷ delivered emails × 100
- Click conversion = ticket buyers ÷ unique clickers × 100
The first shows the business result of the send as a whole. The second shows how well the ticketing page turns interested fans into buyers. For event campaigns, that second view is often the clearest read on demand after the click. If 95 out of 475 clickers buy tickets, that equals a 1% delivered-email conversion and a 20% click conversion.
Why Open Data Gets Noisy After Privacy Changes
Open rate has gotten messy. Apple Mail Privacy Protection, security scanners, and pixel blocking can all add false opens or hide real ones. So while opens still give you a rough sense of direction, they shouldn't carry too much weight on their own.
For event campaigns, it's smarter to lean harder on music promotion tools to track clicks, conversions, and ticket revenue when you're judging fan interest.
How Different Email Types Affect Expected Results
The same metric can mean very different things depending on what the email is trying to do.
A broad monthly newsletter with several links - videos, merch, and multiple tour dates - will usually post a lower CTR because attention gets split. An initial on-sale announcement with one clear "Get Tickets" button should pull stronger clicks and solid conversion from those clicks.
A city-specific reminder sent to a local segment often does better because the audience already has both interest and practical fit. They like the artist, and the show is actually near them. Last-chance emails often get the highest click conversion because the people who click that late are usually ready to act. Post-show follow-ups are different again. Those may drive engagement, not ticket sales.
Next, compare these metrics with benchmark ranges to see if performance looks weak, average, or strong. Understanding these numbers is a key part of music promotion across platforms.
sbb-itb-e819543
Open and Click Benchmarks for Event Campaigns
Typical Open Rate Ranges for Artist and Event Emails
Use these ranges as directional benchmarks for independent artist campaigns. Average open rates usually fall between 32% and 43%, and many providers cluster around 39% to 40%. Entertainment and event emails tend to come in higher. A 2026 benchmark study put the median open rate for that sector at 46%, compared with about 43% across all industries. Musician-focused benchmarks often land in the 25% to 35% range.
| Segment | Average Open Rate | What Strong Looks Like |
|---|---|---|
| All industries (U.S.) | 32–43% | 43%+ |
| Entertainment & events | ~46% | 50%+ |
| Music / artist newsletters | 25–35% | 35%+ |
For a concert-specific send, treat 30% as the floor for a broad list blast. If you're sending to a well-segmented local group - fans within a reasonable travel radius of the venue - you should be aiming for 40% to 50%. That lines up with entertainment and event norms. Once you get above 50% on a local send, that usually points to sharp targeting and a subject line that did its job.
What Click Rate and Click-to-Open Rate Say About Ticket Intent
Use open rate to measure reach. Then use CTR and CTOR to judge ticket intent.
CTR shows how many delivered emails turned into clicks. CTOR shows how well the email turned opens into clicks.
For event announcements:
- CTR around 1–2% is weak
- 2–4% is average
- 4–7%+ is strong
- CTOR under 10% is weak
- 10–20% is average to good
- 20%+ is strong
The big pattern to watch is high opens with weak clicks. That usually means people were interested enough to open the email - maybe the subject line worked, or your name got their attention - but the message didn't give them a clear reason to act. In plain terms, the interest was there, but the push to buy wasn't.
That often points to issues like:
- a buried ticket link
- a vague CTA
- a show that feels too far away
- ticket pricing that doesn't fit most of the list
On the flip side, average opens with high CTOR can point to a smaller group with strong intent. Think local superfans. They may not be a huge segment, but for them, the offer feels immediate and relevant.
Standard Artist Emails vs. Pre-Event and Post-Event Sends
These ranges change based on the type of send.
| Email Type | Typical Open Rate | Typical CTR | Typical CTOR |
|---|---|---|---|
| Standard artist email | 25–35% | 2–4% | 10–20% |
| Pre-event announcement | 40–55% (local/segmented) | 3–7%+ | 15–25%+ |
| Post-event follow-up | 35–50% | 3–6% | 15–25%+ |
Pre-event emails often beat standard sends because they are time-sensitive and locally relevant. Those two factors push fans to open and act faster. Post-event emails can also perform well, since recipients still have a recent connection to the show - either they went, or they came close to going.
Connecting Clicks to Ticket Sales and Fan Demand
Reading Conversion from Delivered Emails and from Clicks
After opens and clicks, conversion tells you whether fan interest turned into money. A click shows intent. A sale shows that intent made it through the rest of the path.
Delivered-email conversion tells you how the whole funnel performed, from list quality and subject line to the offer and checkout. Click-to-sale rate looks only at what happened after the click: the ticket page, pricing, and checkout flow.
Here’s a quick example: if you send 2,000 emails for a local club show, get 200 clicks, and sell 20 tickets, your delivered-email conversion rate is 1.0% (20 ÷ 2,000) and your click-to-sale rate is 10.0% (20 ÷ 200). The first means the send produced 1 buyer per 100 delivered emails. The second means 1 in 10 clickers finished the purchase.
Regional dates often have lower click-to-sale rates because fans may need more time to plan travel, set aside money, or coordinate with friends. That doesn’t always mean the campaign went off track. Sometimes it just means the buying choice is tougher.
What Common Metric Patterns Say About Fan Interest
Read the pattern, then look for the break in the funnel.
High opens with low clicks and low sales usually means the subject line or sender name got attention, but the email itself didn’t give people a strong reason to act. Before you blame the audience, check the basics: Was the ticket link easy to spot? Using custom domains for artist branding can help make links more recognizable and trustworthy. Were the date and venue clear? Did the email give fans a real reason to buy now?
Moderate opens with strong clicks and decent sales often points to a healthy, relevant list. The subject line may not have been flashy, but the people who opened were ready to engage. You’ll often see this with well-targeted local sends or past-buyer segments.
Low performance across all three usually signals a bigger mismatch: a stale list, weak city targeting, bad timing, or an event with low demand in that market. There usually isn’t one magic fix. You need to look at the audience, message, and timing together.
Better segmentation and timing can lead to major gains across all three metrics - music analytics that matter — open rates, clicks, and ticket revenue - when the right message reaches the right audience.
A Simple Scenario Table: Opens, Clicks, and Tickets Sold
Use these examples to spot where the funnel gets weak: reach, intent, or checkout. The formulas are: conversion on sends = tickets sold ÷ emails sent; conversion on clicks = tickets sold ÷ clicks.
| Scenario | Emails Sent | Opens | Clicks | Tickets Sold | Conv. on Sends | Conv. on Clicks |
|---|---|---|---|---|---|---|
| Local club show (segmented list) | 1,000 | 380 (38%) | 80 (8%) | 16 | 1.6% | 20.0% |
| Regional tour date (broad list) | 5,000 | 1,750 (35%) | 300 (6%) | 38 | 0.8% | 12.7% |
| Last-chance reminder (engaged segment) | 2,000 | 700 (35%) | 160 (8%) | 32 | 1.6% | 20.0% |
| Weak send (stale or mismatched list) | 3,000 | 300 (10%) | 30 (1%) | 2 | 0.1% | 6.7% |
The table shows three clear patterns. The local club show and last-chance reminder produce the same conversion rates even with very different list sizes, because both go to people with a clear reason to attend. The regional tour date has a lower click-to-sale rate not because the email did poorly, but because buying a ticket in another city brings more friction. And the weak send shows how fast all three metrics fall apart when the list doesn’t fit the offer.
Attribution changes the numbers. Many email platforms credit sales within a post-click window, often 5 days. That helps estimate contribution without saying the email caused every sale. It also means your numbers can move based on the attribution window, so check what your platform uses before you compare campaigns.
Conclusion: Read All 3 Metrics Together to Judge Campaign Quality
The Main Takeaway for Artists and Labels
After each send, look at the full funnel, not just the top-line number. Opens show attention. Clicks show intent. Sales show buying demand.
The best read comes from all three together. High opens without clicks usually mean people were curious, but not ready to act. Average opens with strong clicks and sales often point to strong local demand. In other words, the pattern matters more than any single send.
Compare sends by city, campaign type, and on-sale timing to spot where demand is actually there. A small club show in a strong fan market will often beat a larger venue in a colder city. You only see that clearly when you line up the same metrics across several sends.
What to Review After Each Event Email Send
To keep those comparisons consistent, review the same six numbers every time:
- delivered emails
- opens
- clicks
- CTOR
- tickets sold
Watch CTOR closely. If CTOR is weak, the email got attention but did not turn opens into action. That’s the signal to adjust the next send.
To follow that funnel the same way each time, use tools that connect email clicks to ticket actions. PromoLinks.me can help track clicks, captures, and ticket actions with event pages, smart links, QR codes, fan email capture, and real-time analytics.
FAQs
Which metric matters most for ticket sales?
For ticket sales, the metric that matters most is conversion rate from event-page visitors to ticket purchases. In plain English: how many clicks or RSVPs turn into paid tickets.
PromoLinks.me tracks event-page performance over time, including views, clicks, unique visitors, CTR, and RSVPs. That gives you a clear way to connect ticket purchases with fan intent signals.
Why can open rates be misleading now?
Open rates can be misleading. They often work more like vanity metrics than clear proof of fan engagement or real interest.
Sure, a high open rate is a good sign. But it doesn’t tell you if fans clicked, took action, or bought tickets. To get a better read on campaign performance, look at open rates alongside click-through rates and ticket sales, including data tracked through PromoLinks.me.
What should I fix if clicks are high but sales are low?
High clicks but low sales usually point to a mismatch between the traffic you're bringing in and what people see on your landing page. If your landing page conversion rate is below 10%, it's time to take a hard look at the page design, the offer, or both.
Start with the basics. Make sure the page works well on mobile, since that's where a lot of music fans will first see it. Then test a few changes, such as:
- Different call-to-action buttons
- New page layouts
- An audio preview so people can hear what they're getting
It also helps to double-check your targeting. If you're promoting to the wrong audience, even a solid page can fall flat. Your targeting should line up with fans based on music style and location.
Related Blog Posts
Ready to create your smart links?
Join thousands of artists using PromoLinks to promote their music smarter.
Get Started Free