7 Music Analytics Tools for Cross-Platform Tracking
7 Music Analytics Tools for Cross-Platform Tracking
If I want the full picture, I can’t rely on one dashboard. I need one tool for clicks, one for listens, and one for market movement. That’s the big takeaway here.
Here’s the short version:
- PromoLinks.me shows where traffic came from and where fans clicked
- Spotify for Artists shows streams, saves, followers, and source of streams inside Spotify
- Apple Music for Artists shows listeners, purchases, and Shazam activity
- YouTube Analytics shows views, watch time, retention, and traffic sources
- Chartmetric compares growth across platforms and against other artists
- Soundcharts tracks playlist, radio, TikTok, and chart movement across services
- Songstats is built for live alerts on playlist adds, chart entries, and radio plays
The article’s main point is simple: don’t mix music analytics that matter from different stages of the fan path. A smart-link click is not a stream. A stream is not a playlist trend. If I keep those lanes separate, reporting gets much easier to read. This is a core pillar of music promotion across platforms.
A few numbers stand out:
- Spotify streams per listener of 1.5 to 2.5 is a solid range for newer artists
- 3.0+ can point to stronger repeat listening
- Soundcharts tracks 61 daily-updated metrics
- Songstats includes live monitoring across Spotify, Apple Music, YouTube, TikTok, Shazam, and radio
- PromoLinks.me starts at $7/month
- Chartmetric starts at about $5/month
- Soundcharts starts at about $10/month
- Songstats paid plans go up to €75/month
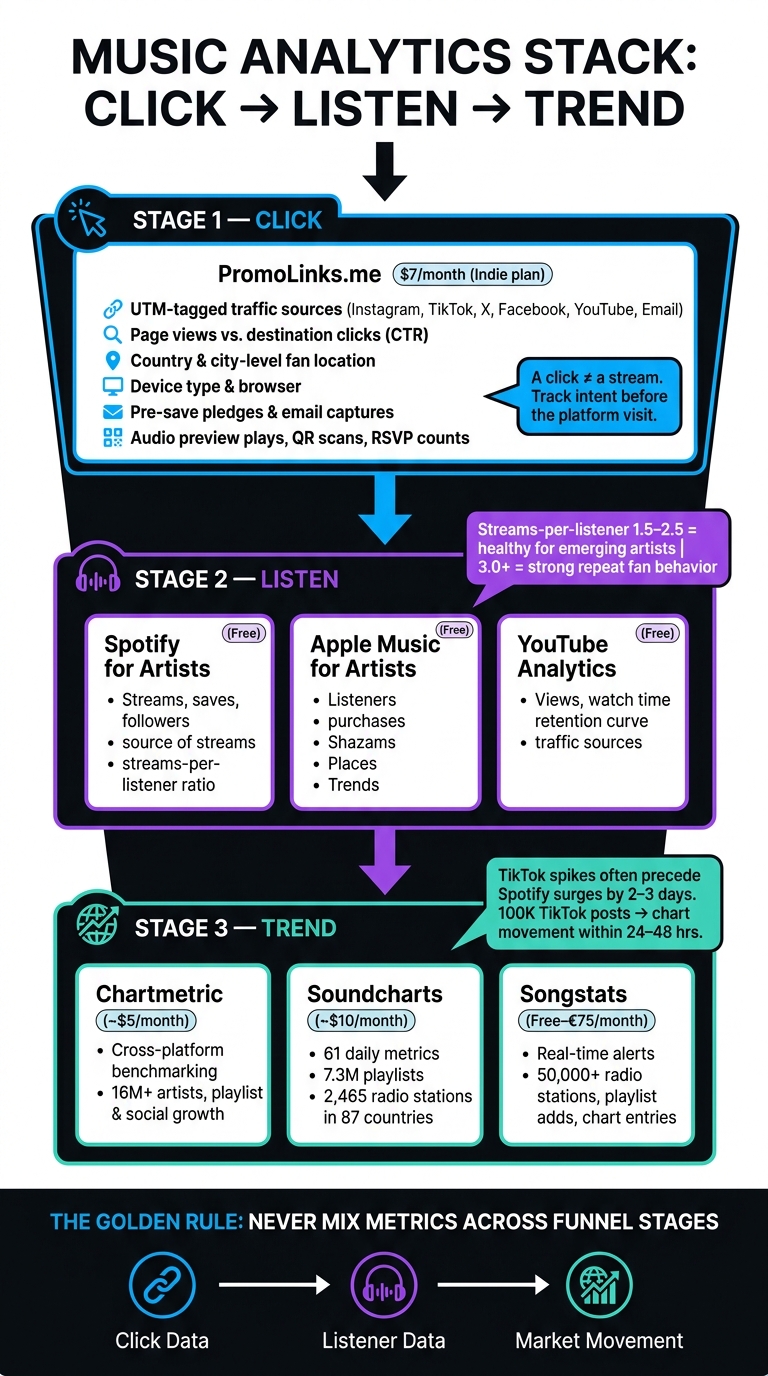
Music Analytics Stack: Click → Listen → Trend
Songstats: The Best Music Analytics Platform
sbb-itb-e819543
Quick Comparison
| Tool | Best for | Main data |
|---|---|---|
| PromoLinks.me | Pre-click and pre-release tracking | UTM traffic, page views, clicks, pre-saves, email capture |
| Spotify for Artists | Spotify listening behavior | Streams, listeners, saves, followers, source of streams |
| Apple Music for Artists | Apple ecosystem data | Listeners, purchases, Shazams, Places, Trends |
| YouTube Analytics | Video performance | Views, watch time, retention, traffic sources |
| Chartmetric | Cross-platform comparison | Platform growth, playlists, audience, charts |
| Soundcharts | Release monitoring | Radio, playlists, TikTok, streaming signals |
| Songstats | Live alerts | Playlist adds, chart moves, radio plays, milestones |
My read: the best setup is a simple 3-part stack - link tracking, platform analytics, and trend monitoring. That gives me a clean way to follow the path from click → listen → trend without mixing numbers that mean different things.
What Cross-Platform Music Analytics Should Actually Measure
Before you compare tools, get clear on the metrics that matter. Start at the top with traffic sources, then follow the path down to clicks and streams.
Traffic sources tell you where a listener came from before they clicked your link. If you add ?utm_source=instagram or ?utm_source=tiktok to smart link URLs, you can see which post, bio link, or ad drove the visit. After that, location and device data help shape better decisions. City-level geography can help with tour routing and local ad spend, while mobile-versus-desktop splits show how the landing page should be built.
Clicks matter just as much as visits. Destination clicks show which platforms your audience leans toward. And link-page analytics can separate a page view from a button click. That matters because a click shows intent, but it does not prove someone streamed the song .
Lower in the funnel, streams, saves, watch time, and Shazams each tell you something different. Streams show reach. Saves point to intent. Watch time shows whether a video keeps people around. Shazams are a strong discovery signal because they show that someone heard a track outside your channels and decided to identify it. Repeat behavior matters too. Running pre-save campaigns and using Spotify's Future Save feature can point to retention.
Metric names also shift from platform to platform, and that can get confusing fast. A "View" on a smart link means a page visit. A "View" on YouTube means a video play. A "Click" on a link page only tells you someone tapped a destination button - it does not confirm a stream . Spotify can share a fan's display name and email, while Apple Music pre-saves stay anonymous because of platform privacy rules.
That gap can skew pre-save comparisons. Once those definitions are clear, it gets much easier to judge which tools track each signal best.
1. PromoLinks.me
Website: promolinks.me
Best for: Tracking fan behavior before and around the platform visit
PromoLinks.me focuses on the first part of the funnel: the space between a click and the actual platform visit. It logs the referral source, location, device, and destination choice before the DSP visit happens. That makes it a good fit when you need attribution data before a platform dashboard can log a stream.
The main feature is the smart link. It detects a fan’s preferred streaming platform and sends them there automatically. Each link tracks page views, destination clicks, and click-through rate in real time. So if you share campaign links with UTM tags like ?utm_source=tiktok, you can see which sources send the most traffic and which ones lead to the most destination clicks.
It also includes pre-saves, QR codes, event pages for RSVPs, and audio previews before the DSP click, all inside one dashboard. That’s useful when you want to turn pre-release activity and link-page traffic into trackable audience data.
Link pages can also collect fan email addresses, and you can connect Meta and TikTok tracking pixels for retargeting. Location data goes down to the city level, which helps with tour planning and local ad spend.
| Metric Category | What PromoLinks.me Tracks |
|---|---|
| Traffic Source | UTM-tagged referrals from Instagram, TikTok, X, Facebook, YouTube, Email |
| Fan Location | Country and city-level data |
| Device & Browser | Device type, browser breakdown |
| Engagement | Audio preview plays, QR scans, RSVP counts, pre-save pledges |
| Conversion | Page views vs. destination clicks (CTR), platform choice |
| Fan Identity | Email captures, Link Gate redemptions with timestamps |
Pricing starts at $7/month when billed yearly on the Indie plan. Pro starts at $15/month and adds all-time analytics and the Fan Wall. Pixel retargeting is available starting with the Indie tier.
For listening data inside the platforms themselves, the next tools cover native DSP and video analytics.
2. Spotify for Artists
Website: artists.spotify.com Best for: Listening data and stream behavior inside Spotify
Claim your artist profile to get into Spotify for Artists and track streams, listeners, saves, followers, and trends.
Once someone clicks through and starts listening, Source of Streams shows where those plays came from: editorial playlists, algorithmic playlists, or user playlists. That split matters when you're making campaign calls like playlist pitching or picking release timing. If a track is getting most of its plays from algorithmic playlists, for example, that tells a different story than a song getting picked up by user playlists.
Another number to watch is save rate. If streams are high but save rate is low, that often points to playlist-led exposure instead of people turning into fans. A streams-per-listener ratio between 1.5 and 2.5 is seen as healthy for emerging artists, while a ratio above 3.0 points to strong fan behavior and repeat listening.
For location data, the dashboard shows top countries and top cities, along with available age and gender breakdowns. City-level growth can help you spot where to run ads or where a tour stop might make sense.
Spotify for Artists only shows what happens inside Spotify, so it helps to pair it with other tools for Apple Music, YouTube, and link-page activity. Use Spotify as your post-click readout; the next sections cover Apple Music and YouTube.
Pricing: Free
3. Apple Music for Artists
Website: artists.apple.com | Best for: Apple Music, purchases, and Shazam data in one place
To get access, you need to claim your artist profile through an authorized distributor or a label connection. After approval, you and your team can use the dashboard. In plain English, this is your post-click readout for listeners inside Apple’s ecosystem.
The dashboard tracks real-time metrics like listeners, purchases, and Shazams. Shazams are a strong sign of intent. Someone heard your track out in the world and took the extra step to identify it.
Apple Music also shows geographic Shazam data. That’s where things get useful fast. You can use city-level Shazam clusters to time local ads, plan tour routing, and shape regional outreach before momentum slips away.
The Trends and Places views help you tell the difference between a short editorial bump and growth that keeps showing up on its own. That split matters when you’re deciding where to put tour dollars or ad spend.
One thing to watch: keep Apple Music metrics separate from Spotify’s. The definitions and available metrics are different on each platform.
| Metric | What It Signals | How to Use It |
|---|---|---|
| Shazams | High-intent discovery | Use geographic clusters to target local ads or tour dates |
| Listeners | Unique reach | Divide streams by listeners to gauge audience depth |
| Purchases | Financial intent | Track alongside Shazams to identify high-value fan markets |
| Trends / Places | Market momentum | Separate short-lived editorial spikes from lasting organic growth |
Next, use YouTube Analytics to see how that interest turns into watch behavior.
4. YouTube Analytics
Website: studio.youtube.com | Best for: Video performance, watch behavior, and traffic source quality
YouTube Analytics is YouTube’s built-in view of what happens after the click. It shows views, watch time, retention, traffic sources, geography, device type, and returning viewers. But the main job here isn’t just counting views. It’s figuring out which sources bring people who actually stick around.
Use channel-level data to track overall growth. Then use video-level data to judge each release on its own. At the video level, the retention curve is one of the most useful reports. It shows where viewers drop off and which traffic sources led to the most watch time. That helps you see which releases hold attention instead of just pulling in traffic.
Traffic source reports matter a lot for music promotion tools and campaigns. The External category includes views from social media, embedded players, and outside websites. Start with the sources that drive the most watch time, not just the most clicks. For paid campaigns, compare paid viewer retention against your organic baseline. If paid viewers leave earlier than organic viewers, your targeting likely needs work.
Shorts and long-form videos do different things. Shorts work well for top-of-funnel discovery. Full-length videos are better for deeper engagement and bringing viewers back.
| Traffic Source | Quality Indicator | What to Do |
|---|---|---|
| Social (External) | High CTR + high retention | The content fits the audience - scale it |
| Embedded | Watch time per embed source | Find which sites are sending engaged viewers |
| Paid (Ads) | Retention vs. organic baseline | Tighten targeting if paid viewers drop off faster |
| Creator/Collab | New vs. returning viewer ratio | Check whether collaborator traffic comes back |
For market planning, pay close attention to cities where view growth is picking up, not just the places with the highest total views.
Use YouTube to measure video demand, then line that up with broader cross-platform data.
5. Chartmetric
Website: chartmetric.com | Best for: Cross-platform benchmarking and market research
If the earlier tools show what’s happening inside one platform, Chartmetric shows how those signals stack up across platforms and against similar artists. It pulls data from Spotify, Apple Music, YouTube, TikTok, and Instagram, with coverage of more than 16 million artists.
The platform tracks playlist activity, audience demographics, social growth, and chart positions across services. Where it stands out is comparison. With Artist Comparison, you can benchmark growth and check whether social buzz is turning into streams.
Pricing starts at about $5/month for the Artist plan and goes up to $150/month for the Ultra tier, as of June 2026. If you only need reporting from one platform, the native dashboards may be enough. But when you want market context - like scouting other artists, comparing playlist growth, or putting together label-level reports - Chartmetric makes a lot more sense.
One thing to watch: aggregated counts and real-time reports don’t always use the same timing. That means you’ll want to keep your definitions and date ranges lined up when you compare numbers.
Use Chartmetric when you need market context, then move to the next tool for live monitoring of platform-level signals.
6. Soundcharts
Website: soundcharts.com | Best for: Release momentum tracking and global radio monitoring
If Chartmetric is your tool for benchmarking, Soundcharts is what you use when you want to watch momentum in motion. It pulls streaming, social, and radio data into one dashboard, so you can track how a release is moving across TikTok, Spotify, Apple Music, Deezer, and radio without hopping between platforms.
The platform tracks 61 daily-updated metrics across more than 16 million artists. It also covers playlist and radio activity across more than 7.3 million playlists and 2,465 radio stations in 87 countries.
That matters when you're trying to spot a market where radio starts to move before streaming follows. If a track is heating up on air but hasn't hit on Spotify yet, that can shape your next move, whether that's social ad spend, radio push, or promoting your single with another round of promo.
It can also help you catch lag between platforms. For example, TikTok spikes often come before Spotify surges by 2–3 days, and 100,000 TikTok posts usually come before chart movement within 24–48 hours. So if you set a lower creation-count alert, you may catch that wave earlier instead of waiting until the charts react.
One thing to keep in mind: Soundcharts shows parallel signals, not verified cross-platform attribution. In plain English, it can show that activity is happening across channels at the same time, but it can't prove one platform caused the lift on another. For platform-specific reporting and submissions, stick with first-party dashboards.
Pricing starts at about $10/month for the Artist plan. That includes multi-year history, playlist monitoring, and daily alerts. Label-tier API access starts at $250/month, and data-share tiers start at $500/month.
7. Songstats
Website: songstats.com | Best for: Real-time alerts and cross-platform activity monitoring
If Soundcharts shows momentum across platforms, Songstats helps you act on it right away. It’s built around real-time alerts, so you can catch changes while they’re happening instead of finding them hours later. The live Activity Feed and push alerts surface playlist adds, chart entries, milestones, and radio plays as they happen. It tracks Spotify, Apple Music, YouTube, TikTok, Shazam, and radio in one dashboard.
This is where Songstats stands out: once a campaign starts moving. When a track begins to pick up steam, timing matters. A playlist add at 2:00 a.m. can turn into a social post, artist update, or ad tweak first thing in the morning. Check out our guides and comparisons for more promotion tips. Songstats makes those moments easier to spot.
Its Radiostats service monitors more than 50,000 radio stations worldwide, with a focus on instant alerts and live airplay monitoring.
A simple way to use it: open the activity feed each morning and check what happened overnight. Look for new playlist adds, chart movement, or radio spins, then react while the spike is still new. Playlist Journey also helps you tell the difference between a short editorial bump and longer-lasting playlist support. That gives you a fast read on movement before you double-check audience details in native platform dashboards.
There’s a catch, though. Songstats gives you a broad view across platforms, but it doesn’t dig as deep into audience demographics as the native tools do. If you need age, gender, or discovery-source data, Spotify for Artists and Apple Music for Artists still do a better job. So Songstats works best as an alert layer, not as a full replacement for native analytics.
Pricing includes a free tier with basic overview stats. Paid plans add real-time push notifications, full-catalog tracking, and PDF/CSV exports. The Professional Plan costs €75/month.
How to Use These Tools Together Without Mixing Incompatible Metrics
Each tool here measures a different part of the fan journey. That’s not a flaw. That’s the whole point.
The issue starts when you compare numbers that belong to different stages. A click is not the same as a listen. A listen is not the same as an audience signal. And none of those are the same as a cross-platform trend. The fix is simple: assign each tool to one funnel stage and compare only similar metrics.
Use PromoLinks.me for traffic and click paths, native platform dashboards for listening data, and Chartmetric or Songstats for cross-platform trend checks. Stick to the funnel order already in place: click → listen → audience signal → cross-platform trend. PromoLinks.me covers the click stage through smart link analytics and UTM parameters like ?utm_source=instagram. Spotify for Artists, Apple Music for Artists, and YouTube Analytics handle the listening stage. Email capture, retargeting pixels, and pre-save opt-ins inside PromoLinks.me turn clicks into audience data you can actually use. Then Chartmetric and Songstats show cross-platform trend signals across all of it.
Lifetime totals can blur what’s happening right now, so anchor every report to Release Day, Day 7, Day 14, and Day 28.
Before you compare results, lock the same fields across every report:
| Field | Why It Matters |
|---|---|
| Campaign name | Ties reports across tools to one release |
| Date range | Prevents lifetime totals from masking actual momentum |
| Territory | Validates city-level and country-level growth for tour routing and local ad tests |
| Release ID | Keeps exports aligned across platforms and reports |
| Reporting cadence | Daily checks, weekly reviews, and post-release recap keep reporting consistent |
Once those fields match, the comparison table becomes a clean at-a-glance guide.
You can also use streams per listener as a fan-depth check. A range of 1.5 to 2.5 is healthy for emerging artists, while 3.0+ points to stronger repeat listening.
Use these definitions to read the comparison table without mixing metrics that track different parts of the funnel.
Comparison Table
Use this table to line up each tool with the metric layer it owns. Read it by funnel stage: click, then listen, then cross-platform trend.
| Tool | What It Measures | Coverage | Campaign Use Case | Geographic Insight | Device / Source Data | Key Limitation |
|---|---|---|---|---|---|---|
| PromoLinks.me | Smart-link clicks and conversions | All major DSPs and social platforms | Pre-saves and email capture | City/country visit data | UTM-tagged referrers from Instagram, TikTok, X, and other sources | Tracks link interactions only, not post-click streams |
| Spotify for Artists | First-party streaming data | Spotify only | Release tracking and playlist pitching | City/country listener locations | Discovery sources such as editorial, algorithmic, and user playlists | No cross-platform or competitive data |
| Apple Music for Artists | First-party streaming and Shazams | Apple Music and Shazam | Shazam-driven discovery | Shazam-integrated city clusters | Shazam discovery signals | Apple Music and Shazam data only |
| YouTube Analytics | First-party video behavior | YouTube only | Audience retention and video performance | Location and device data | Internal search, suggested videos, and external embeds | YouTube only; background plays can inflate reach |
| Chartmetric | Aggregated market intelligence | All major streaming and social platforms | Competitive benchmarking and A&R scouting | Audience demographic breakdowns | Cross-platform growth trends | Can be expensive for independent artists |
| Soundcharts | Playlist, radio, and chart monitoring | Spotify, Apple Music, Deezer, radio, and TikTok | Radio tracking and playlist monitoring | Radio airplay data | Real-time TikTok and radio activity | More useful for monitoring than for deep social attribution |
| Songstats | Real-time activity alerts | Spotify, Apple Music, YouTube, TikTok, radio, and more | Real-time playlist and chart spike monitoring | City-level growth signals | Playlist, chart, and radio alerts | Advanced demographics are locked behind higher-tier plans |
The pattern here is pretty simple. PromoLinks.me tells you what happened at the click stage. Tools like Spotify for Artists, Apple Music for Artists, and YouTube Analytics show what happens once people start listening or watching. Then Chartmetric, Soundcharts, and Songstats help you watch movement across platforms, playlists, charts, and radio.
That matters because no single dashboard gives you the whole picture. One tool shows intent. Another shows consumption. Another shows how the song is moving in the market.
Conclusion
The clearest setup uses three tool layers. This keeps click data, listener data, and market movement in separate lanes, which makes the whole picture easier to read.
Give each tool one job. Use PromoLinks.me when you want to see which social platform drove a click or how many fans converted through a pre-save campaign. Use Spotify for Artists or Apple Music for Artists for listener behavior, saves, skips, and discovery sources. Then bring in Chartmetric, Soundcharts, or Songstats to follow playlist momentum, radio airplay, or cross-market growth over time.
The path to track is simple: click, listen, trend. Start with link data to find the source. Then check platform dashboards to understand behavior. After that, use cross-platform aggregators to spot momentum.
FAQs
Which metrics should I track first?
Start with click-through rate (CTR). It shows how well your design and call to action connect with fans.
Then look at platform preference, referral sources, and conversion rates for actions like pre-saves. Total clicks, unique visitors, plus geographic and device data, help you see your reach and make future campaigns better.
How do I avoid mixing clicks and streams?
Clicks and streams measure different parts of the fan journey. They also come from separate systems.
PromoLinks.me tracks what happens on your smart link: clicks, traffic sources, and which platform people pick. Streaming services track what happens after that, including the actual stream.
To keep things clear, use PromoLinks.me to see where your traffic came from and which platforms your audience prefers. Then use your distributor or streaming platform dashboards for stream counts and payout data.
What is a good streams-per-listener ratio?
There isn’t a set benchmark for a “good” streams-per-listener ratio.
So instead of chasing a single number, look at engagement metrics you can act on, like pre-save-to-stream conversion rates. For example, an average of 68% of fans stream a track within the first 48 hours of release.
Related Blog Posts
Ready to create your smart links?
Join thousands of artists using PromoLinks to promote their music smarter.
Get Started Free